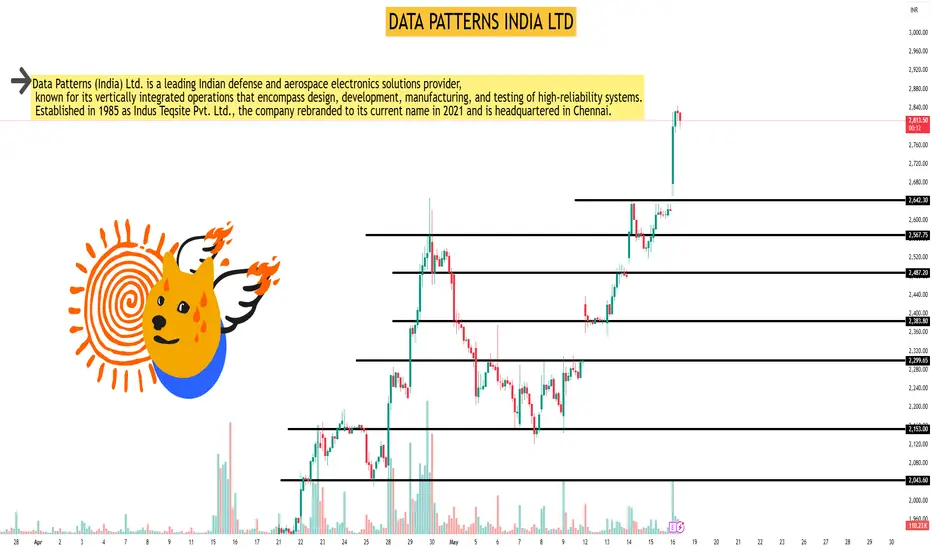
As of May 16, 2025, Data Patterns (India) Ltd. (NSE: DATAPATTNS) exhibits a mildly bullish trend on the 45-minute timeframe, based on key technical indicators.
📊 45-Minute Technical Snapshot
Current Price: ₹2,821.20
20 SMA: ₹1,569.44
50 SMA: ₹1,546.58
Signal: Mild Bullish
Latest Price / MA Crossover: 7 ticks back
Crossover Type: Bullish
Analysis: Mild 20MA up, Mild 50 MA Uptrend, Mild Buy
📈 Additional Technical Indicators
Relative Strength Index (RSI): 72.31
Rate of Change (ROC): 56.07
Average Directional Index (ADX): 25.6
📉 Candlestick Patterns
Bullish Marubozu: Indicates strong buying pressure.
Long White Candle: Suggests bullish momentum.
📌 Summary
The 45-minute technical analysis of Data Patterns (India) Ltd. indicates a mildly bullish trend, supported by moving average crossovers and positive momentum indicators. However, the RSI suggests the stock is approaching overbought territory, warranting cautious optimism.
Hello Guys ..
WhatsApp link- wa.link/d997q0
Email - techncialexpress@gmail.com ...
Script Coder/Trader//Investor from India. Drop a comment or DM if you have any questions! Let’s grow together!
WhatsApp link- wa.link/d997q0
Email - techncialexpress@gmail.com ...
Script Coder/Trader//Investor from India. Drop a comment or DM if you have any questions! Let’s grow together!
Related publications
Disclaimer
The information and publications are not meant to be, and do not constitute, financial, investment, trading, or other types of advice or recommendations supplied or endorsed by TradingView. Read more in the Terms of Use.