The DFM Index (\
🔍 What the Chart is Saying:
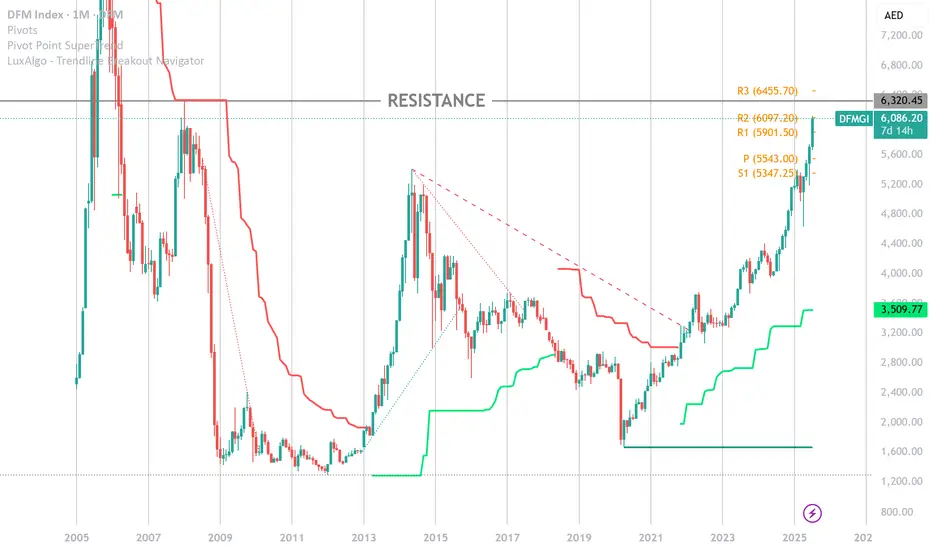
* The monthly candles show strong bullish momentum, with 7 consecutive green bars and a +6.67% monthly gain so far.
* RSI is deeply overbought at 82.80, which historically signals cooling-off zones or consolidation phases. ⚠️
* The index has broken out of a multi-year accumulation zone (between \~2,300 and \~4,000), suggesting a long-term trend reversal is intact. 📈
* Current price is far extended from both the Hull MA (9) at 6,096 and historical pivot levels (Classic P = 5,542.98), indicating stretched conditions. 🧭
🧠 Key Levels to Watch:
* Immediate Resistance: 6,320 (multi-year peak zone)
* Support: 5,901 (R1), then stronger floor near 5,542 (pivot)
* If we break above 6,320 with volume, upside continuation toward **6,651 (R3)** is likely 🔓
⚖️ Insight:
DFM is on fire 🔥, but risk is rising. The structure remains bullish, but traders should watch for signs of bearish divergence or exhaustion candles as we near historical highs. 📉 A healthy pullback could offer better entry zones for trend-followers.
📌 Summary:
🌟 Trend = Bullish
📈 Momentum = Strong but Overheated
🕰️ Outlook = Wait for confirmation or consolidation
Disclaimer
The information and publications are not meant to be, and do not constitute, financial, investment, trading, or other types of advice or recommendations supplied or endorsed by TradingView. Read more in the Terms of Use.
Disclaimer
The information and publications are not meant to be, and do not constitute, financial, investment, trading, or other types of advice or recommendations supplied or endorsed by TradingView. Read more in the Terms of Use.