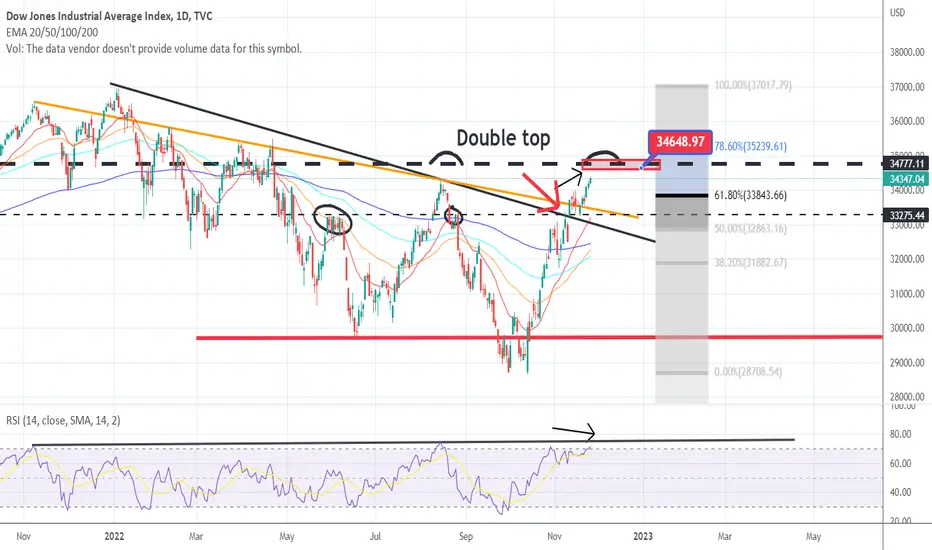
Now i should be bullish, why because it passed the trendline and became support even it passed the 61,8°FIB.
My last idea was: orange trendline, dashed line on 33275 and hidden bearish divergence.
Like you could see it bounce from that target (see RED ARROW) but you would be stopped out after.
On TA you would say bullish yes, but for me it's still very hard to believe.
I can't for the moment. So what do i see (Perma bear):
-A double top
-still hidden bearish divergence (black arrows)
On the RSI we have a black trendline, maybe still a touch before coming down (it's too way overbought)
I see a massive trap for the bulls, meaning the bears are stopped out, we go a little higher for a bigger bull trap
Going between 34666-34950 (Red box) and big black dashed line
The top from NOV and JAN is 1,15%, If we do this the same with the top from aug, we get that target in the red box.
Only question is, will that be a big pullback or the beginning of another bull run.
Still the corona low is far away, but not impossible.
Disclaimer
The information and publications are not meant to be, and do not constitute, financial, investment, trading, or other types of advice or recommendations supplied or endorsed by TradingView. Read more in the Terms of Use.
Disclaimer
The information and publications are not meant to be, and do not constitute, financial, investment, trading, or other types of advice or recommendations supplied or endorsed by TradingView. Read more in the Terms of Use.