Greetings to the TradingView community, here's a detailed look at DXY where technical structure and macro context may be hinting at a shift.
Dollar Index (DXY) Approaching Key Breakout | Bullish Divergence and Macro Shifts in Focus
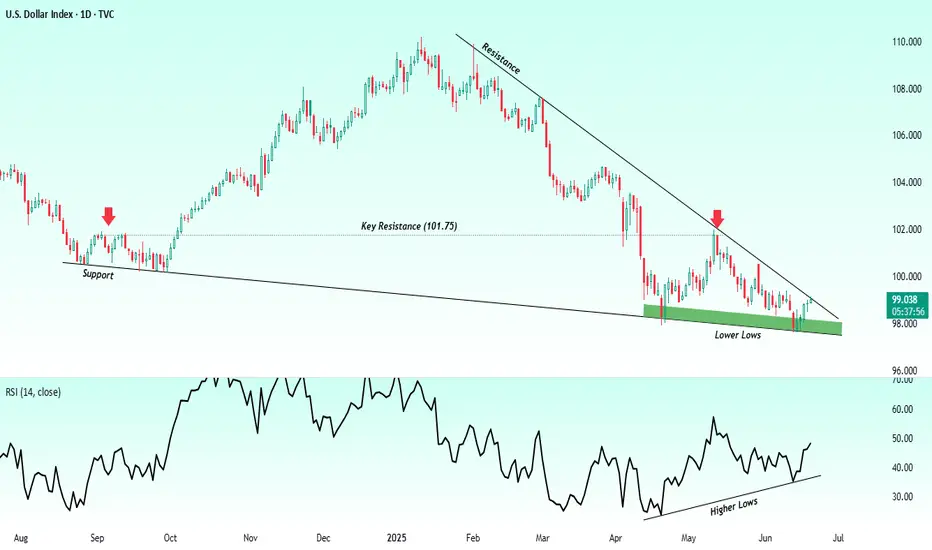
The U.S. Dollar Index (DXY) is currently approaching a structurally important juncture where technical compression is intersecting with potential macroeconomic shifts. Over the past several months, DXY has remained in a well defined downtrend, consistently printing lower highs and lower lows. However, the recent price action reveals signs of exhaustion in bearish momentum, opening the door for a potential trend reversal or a meaningful corrective rally.
Technically the index has been trading within a broad descending wedge pattern since late 2024. This structure, often interpreted as a bullish reversal formation, is now nearing its apex. Price has been hugging the upper boundary of the pattern a descending trendline that has acted as dynamic resistance and appears to be preparing for a possible breakout. Each subsequent test of this trendline has occurred with less momentum on the downside, a common precursor to a breakout when price compresses tightly within narrowing ranges.
More importantly, momentum indicators are beginning to diverge from price. The Relative Strength Index (RSI 14), for instance, is forming a series of higher lows while price continues to record lower lows. This bullish divergence is a classic signal that downside pressure is weakening and that buyers may be gradually absorbing supply. Divergence of this nature, especially in confluence with trendline resistance, often leads to a shift in price behavior.
A key horizontal level to monitor remains 101.75, which has historically acted as a strong resistance zone. This level marked the previous breakout rejection and coincides with the mid-range structure of the wedge. A sustained close above this zone would effectively break the prevailing lower-high formation and could signal a shift in market structure toward a more neutral or even bullish bias.
In terms of projected targets, if a breakout confirms, the logical areas to watch would be the previous swing highs from the downtrend. These include levels in the 102.50 to 104.00 range, where the market has previously paused or reversed. These prior lower highs may now act as resistance on the way up and can be used as checkpoints to gauge the strength of any bullish follow-through.
From a macroeconomic perspective, several factors could support or accelerate such a breakout. Recent U.S. inflation data has shown signs of softening, with both Consumer Price Index (CPI) and Producer Price Index (PPI) prints coming in below expectations. This has increased market speculation that the Federal Reserve may pivot toward a more accommodative stance later in the year. Although the Fed has not confirmed any immediate easing, market expectations around rate cuts are beginning to influence bond yields and, by extension, the dollar.
However, it’s also worth noting that monetary policy divergence among global central banks remains an important theme. While the Fed may lean toward caution, the European Central Bank and the Bank of England are facing their own unique inflationary challenges, which could either reinforce or limit relative dollar weakness. In such an environment, if other central banks appear more dovish than the Fed, it could provide relative strength to the dollar index.
Geopolitical uncertainty and equity market volatility are also important to consider. The dollar has historically acted as a safe-haven asset in times of global distress. If geopolitical tensions escalate or global risk sentiment weakens, capital flows into the dollar may accelerate regardless of interest rate trajectories.
In conclusion, the current DXY setup is a technically rich and macro-sensitive zone where price compression, bullish RSI divergence, and policy shifts are aligning. While confirmation is still needed, particularly via a breakout above the descending trendline and the 101.75 level, the probability of a structural shift is increasing. This setup is not a trading recommendation but rather an important chart to watch for clues about future dollar direction and its cascading impact on global FX pairs, commodities, and broader market sentiment.
Thanks for reading hope you like this publication.
Regards- Amit.
Dollar Index (DXY) Approaching Key Breakout | Bullish Divergence and Macro Shifts in Focus
The U.S. Dollar Index (DXY) is currently approaching a structurally important juncture where technical compression is intersecting with potential macroeconomic shifts. Over the past several months, DXY has remained in a well defined downtrend, consistently printing lower highs and lower lows. However, the recent price action reveals signs of exhaustion in bearish momentum, opening the door for a potential trend reversal or a meaningful corrective rally.
Technically the index has been trading within a broad descending wedge pattern since late 2024. This structure, often interpreted as a bullish reversal formation, is now nearing its apex. Price has been hugging the upper boundary of the pattern a descending trendline that has acted as dynamic resistance and appears to be preparing for a possible breakout. Each subsequent test of this trendline has occurred with less momentum on the downside, a common precursor to a breakout when price compresses tightly within narrowing ranges.
More importantly, momentum indicators are beginning to diverge from price. The Relative Strength Index (RSI 14), for instance, is forming a series of higher lows while price continues to record lower lows. This bullish divergence is a classic signal that downside pressure is weakening and that buyers may be gradually absorbing supply. Divergence of this nature, especially in confluence with trendline resistance, often leads to a shift in price behavior.
A key horizontal level to monitor remains 101.75, which has historically acted as a strong resistance zone. This level marked the previous breakout rejection and coincides with the mid-range structure of the wedge. A sustained close above this zone would effectively break the prevailing lower-high formation and could signal a shift in market structure toward a more neutral or even bullish bias.
In terms of projected targets, if a breakout confirms, the logical areas to watch would be the previous swing highs from the downtrend. These include levels in the 102.50 to 104.00 range, where the market has previously paused or reversed. These prior lower highs may now act as resistance on the way up and can be used as checkpoints to gauge the strength of any bullish follow-through.
From a macroeconomic perspective, several factors could support or accelerate such a breakout. Recent U.S. inflation data has shown signs of softening, with both Consumer Price Index (CPI) and Producer Price Index (PPI) prints coming in below expectations. This has increased market speculation that the Federal Reserve may pivot toward a more accommodative stance later in the year. Although the Fed has not confirmed any immediate easing, market expectations around rate cuts are beginning to influence bond yields and, by extension, the dollar.
However, it’s also worth noting that monetary policy divergence among global central banks remains an important theme. While the Fed may lean toward caution, the European Central Bank and the Bank of England are facing their own unique inflationary challenges, which could either reinforce or limit relative dollar weakness. In such an environment, if other central banks appear more dovish than the Fed, it could provide relative strength to the dollar index.
Geopolitical uncertainty and equity market volatility are also important to consider. The dollar has historically acted as a safe-haven asset in times of global distress. If geopolitical tensions escalate or global risk sentiment weakens, capital flows into the dollar may accelerate regardless of interest rate trajectories.
In conclusion, the current DXY setup is a technically rich and macro-sensitive zone where price compression, bullish RSI divergence, and policy shifts are aligning. While confirmation is still needed, particularly via a breakout above the descending trendline and the 101.75 level, the probability of a structural shift is increasing. This setup is not a trading recommendation but rather an important chart to watch for clues about future dollar direction and its cascading impact on global FX pairs, commodities, and broader market sentiment.
Thanks for reading hope you like this publication.
Regards- Amit.
Disclaimer
The information and publications are not meant to be, and do not constitute, financial, investment, trading, or other types of advice or recommendations supplied or endorsed by TradingView. Read more in the Terms of Use.
Disclaimer
The information and publications are not meant to be, and do not constitute, financial, investment, trading, or other types of advice or recommendations supplied or endorsed by TradingView. Read more in the Terms of Use.