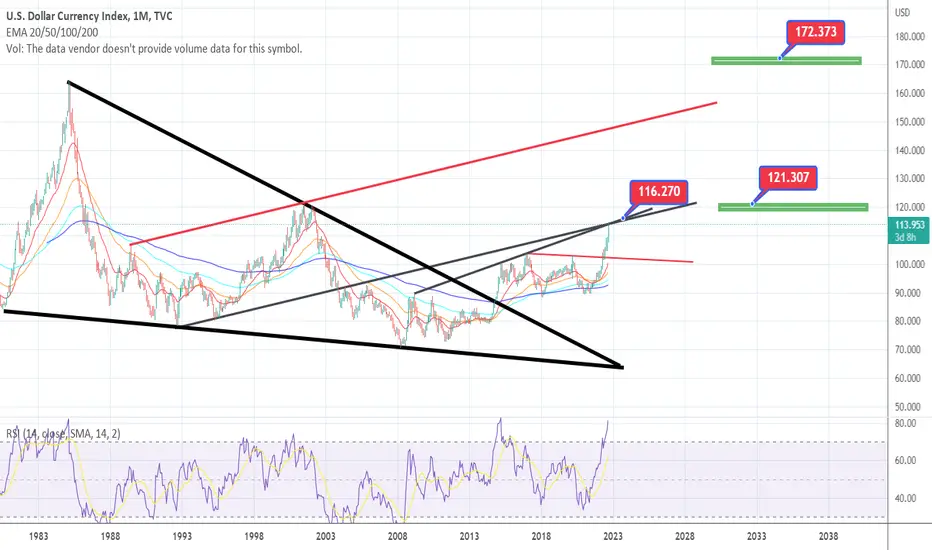
Last time in may i was speaking about the 2 trendlines (black)(previous idea 116,27 depending where it would hit the trendlines), that maybe this was the end of the bear market. Now we're there, probably you also know this far from over if we're speaking about the bear market.
So if we zoom out, you can see a big falling wedge, that one was broken and if you take that measurement, gosh that target could be 172 (but that means we're in a depression instead of a recession).
First we have to see what the DXY should do with the double top around 121,30 (there's heavy resistance)
If the DXY is passing the 121,30 then is my next target the red line but that target is depending where it will hit
So now can we have a pullback on the DXY to build up strengt and after just going up again?
On the longer term there's much more upside for the DXY (IMO)
bullish on the DXY means bearish on the markets
Disclaimer
The information and publications are not meant to be, and do not constitute, financial, investment, trading, or other types of advice or recommendations supplied or endorsed by TradingView. Read more in the Terms of Use.
Disclaimer
The information and publications are not meant to be, and do not constitute, financial, investment, trading, or other types of advice or recommendations supplied or endorsed by TradingView. Read more in the Terms of Use.