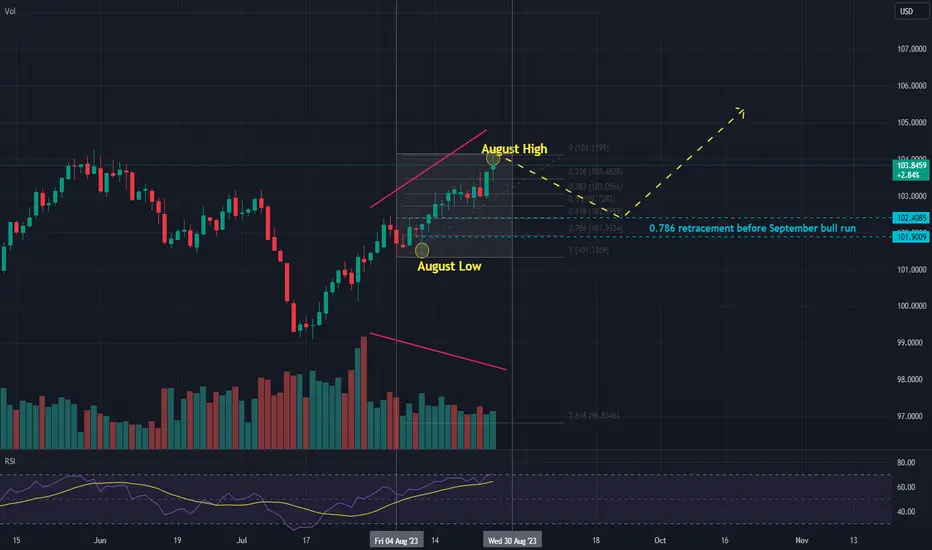
DXY on our daily chart shows a divergence in price movement and Volume. DXY is overbought and as we expect September to be bullish based on its seasonal behavior it looks all ready to start retracing. Keeping in mind this is another September followed by a bullish August, therefore August High and Low as our Fib points the support zone would be the area between 101.9 -102.4 as a retracement of 0.618 - 0.786. Once the retracement reaches that area The DXY would form a perfect overlapping structure and will be expected to start its September bull run again.
Disclaimer
The information and publications are not meant to be, and do not constitute, financial, investment, trading, or other types of advice or recommendations supplied or endorsed by TradingView. Read more in the Terms of Use.
Disclaimer
The information and publications are not meant to be, and do not constitute, financial, investment, trading, or other types of advice or recommendations supplied or endorsed by TradingView. Read more in the Terms of Use.