1. Major Support Levels
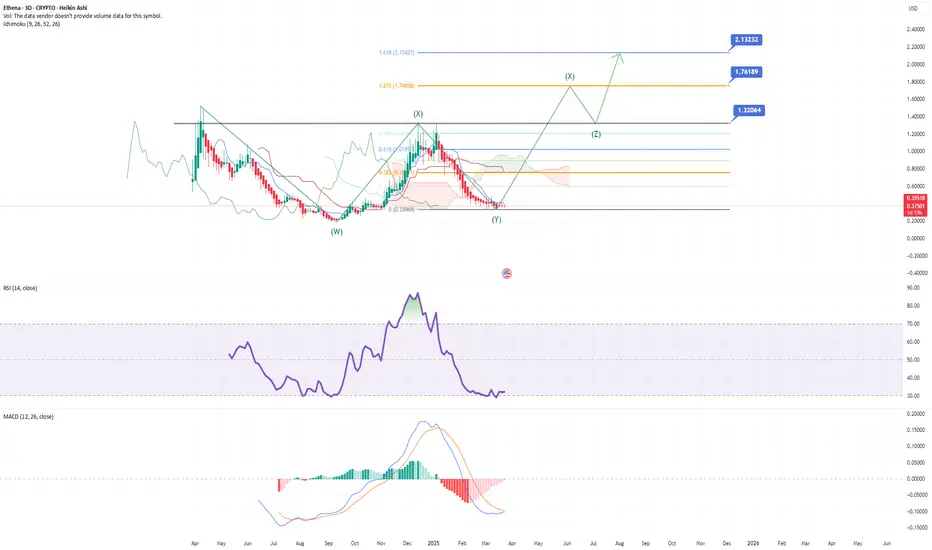
0.3300 - 0.3400: This is a very strong long-term support zone, marking the bottom of the previous bearish cycle (wave (Y)) and aligning with the 0% Fibonacci retracement.
0.3700 - 0.3800: This is the short-term support level where the price is currently consolidating near a thin Ichimoku cloud base.
2. Resistance Levels & Take-Profit Targets
Based on the WXY corrective structure and the projected Z wave, Fibonacci extension levels provide the following targets:
1.3206 (Fibo 0.786): This is your first take-profit level, coinciding with a previous swing high.
1.7618 (Fibo 1.272): The second target, a significant resistance according to Fibonacci extensions.
2.1232 (Fibo 1.618): This is the long-term target and a common level for major trend exhaustion.
3. Technical Indicators Supporting a Potential Wave Z Rally
RSI: Currently oversold at around 32, with a potential double bottom forming, suggesting a bullish reversal might be ahead.
MACD: While still below the signal line, the histogram is narrowing, showing selling pressure is fading.
Ichimoku Cloud: Price is still below the cloud but with a thinning and flattening cloud ahead, increasing the likelihood of a bullish breakout in the medium term.
4. Suggested Long-term Trading Strategy
Long Entry Zone: Accumulate between 0.33 - 0.38 for a long-term position.
TP1: 1.32 (about 3.5x from the bottom).
TP2: 1.76 (around 5x from the bottom).
TP3: 2.12 (6-7x potential return from the current support zone).
Stop-Loss: A weekly candle close below 0.33 would invalidate this long setup, and you should consider exiting.
5. Important Notes
This is a "bottom fishing" setup, so it might take 6 to 12 months for wave Z to fully develop.
Suitable for long-term investors who are comfortable holding for 6+ months.
Watch for confirmation signals like RSI breaking above 50 and MACD bullish cross.
Disclaimer
The information and publications are not meant to be, and do not constitute, financial, investment, trading, or other types of advice or recommendations supplied or endorsed by TradingView. Read more in the Terms of Use.
Disclaimer
The information and publications are not meant to be, and do not constitute, financial, investment, trading, or other types of advice or recommendations supplied or endorsed by TradingView. Read more in the Terms of Use.