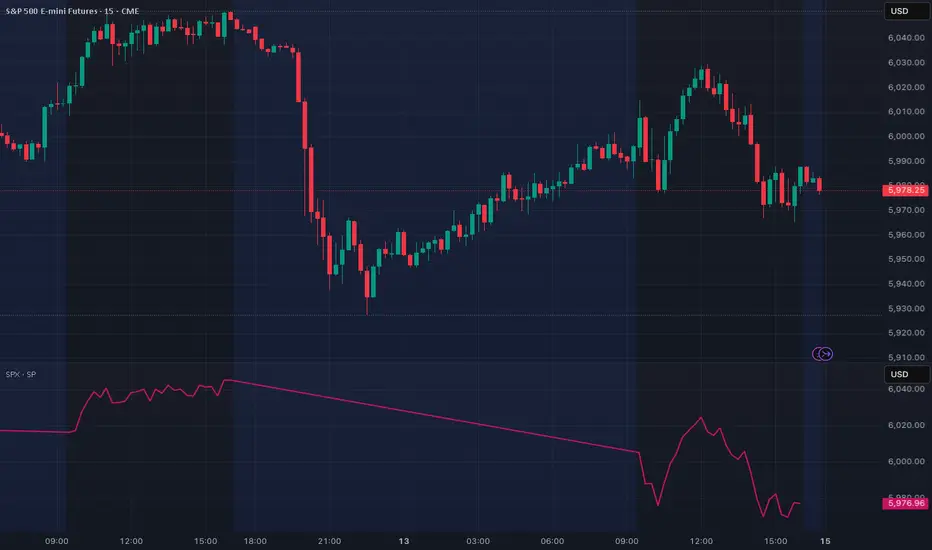
This chart displays the price action of the S&P 500 E-mini Futures (ES), a stock market index futures contract that is traded on the Chicago Mercantile Exchange's Globex electronic trading platform. The S&P 500 index is a capitalization-weighted index that tracks 500 of the largest U.S. companies, making it a key benchmark for the overall health of the U.S. economy and stock market. This particular chart visualizes the ongoing battle between buyers and sellers, with the candlesticks representing the open, high, low, and close prices for each period. By analyzing the patterns and trends on this chart, traders and investors can speculate on the future direction of the S&P 500 index. This analysis is often supplemented with various technical indicators that can provide further insights into market momentum, volatility, and potential turning points. Lower pane is the actual SPX which will be live only during market hours.
Disclaimer
The information and publications are not meant to be, and do not constitute, financial, investment, trading, or other types of advice or recommendations supplied or endorsed by TradingView. Read more in the Terms of Use.
Disclaimer
The information and publications are not meant to be, and do not constitute, financial, investment, trading, or other types of advice or recommendations supplied or endorsed by TradingView. Read more in the Terms of Use.