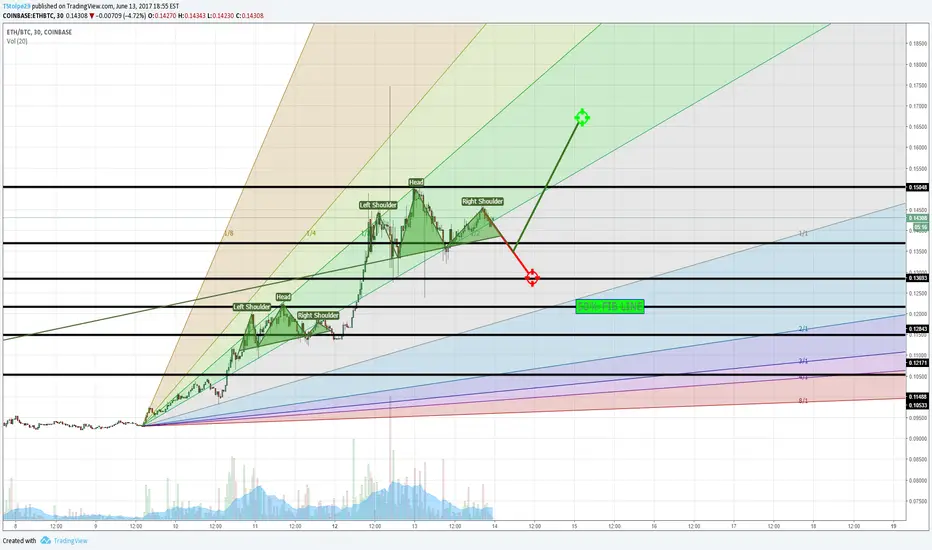
I like to include two options to show no one can really predict it and it can go either way, but this is what I think can happen with Ethereum
Note
Going to start following this chart more closely as it is one of my longs that is doing supremely well!Note
imo, looks like it will finish the short term head shoulders pattern then hit the black fib line i made at .13 before it makes a decision to go on upward or notNote
expect it to touch support but as of right now, it looks strong to stay above?Note
looks like it has found support above that fib lineDisclaimer
The information and publications are not meant to be, and do not constitute, financial, investment, trading, or other types of advice or recommendations supplied or endorsed by TradingView. Read more in the Terms of Use.
Disclaimer
The information and publications are not meant to be, and do not constitute, financial, investment, trading, or other types of advice or recommendations supplied or endorsed by TradingView. Read more in the Terms of Use.