Ethereum (ETH/USD) Weekly Chart Trend Analysis Using Trendline, Fibonacci, and Technical Indicators
In this article, we analyze the overall trend of Ethereum (ETH) against the U.S. Dollar (USD) based on the weekly chart using essential technical tools such as trendlines, Fibonacci retracement/extension, moving averages, and key indicators. These tools help identify support and resistance levels, price momentum, and potential medium- to long-term scenarios.
1. Trendline Analysis
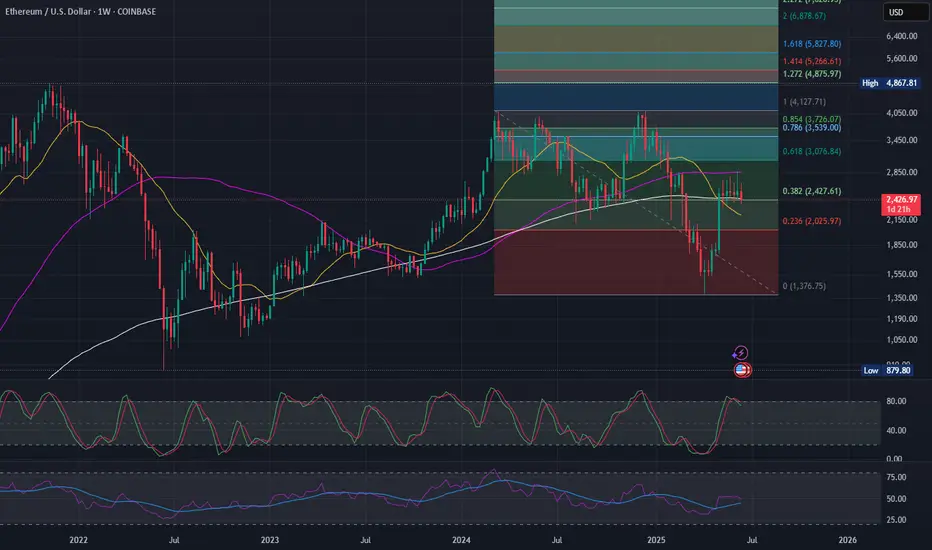
In the weekly chart, the trendline shown with a dashed gray line acts as a key resistance. This line is drawn from the early 2024 high around $4,127 to the late 2024 low near $1,376. This downtrend line reflects continued bearish pressure over several months.
Recently, ETH attempted to breach this trendline. Price has touched or hovered around the line a few times, but weekly candles have not decisively closed above it. A confirmed breakout with multiple weekly closes above this trendline would signal a potential shift from a downtrend to an uptrend.
2. Fibonacci Retracement and Extension Analysis
The Fibonacci retracement tool was applied from the low of $1,376 to the high of $4,127. Key levels are:
0.236 (~$2,026): First major support level after a significant pullback. ETH bounced strongly from here.
0.382 (~$2,428): Current key resistance where price is consolidating. A close above this level would open the path to higher targets.
0.618 (~$3,077): A popular target level in bullish retracements.
1.0 (~$4,127): The previous cycle high. A breakout here would establish a Higher High pattern.
Extension levels (1.272, 1.618, 2.0): Used to project long-term bullish targets beyond the previous high. These lie at $4,875 / $5,828 / $6,878 respectively.
3. Moving Averages (EMA) Analysis
The chart features Exponential Moving Averages:
EMA 10-week (yellow): Tracks short-term trends. Currently flattening.
EMA 50-week (purple): Serves as a medium-term resistance. Price is hovering near this level.
EMA 200-week (white): A long-term structural support. ETH remains above this, indicating it has not yet entered a full bearish market phase.
Holding above the EMA 200 is a positive structural sign, while the flattening of EMA 10 may hint at short-term buying exhaustion.
4. Indicator Analysis
Stochastic RSI: Currently in the Overbought zone with a bearish crossover, indicating a possible short-term pullback.
RSI (Relative Strength Index): Formed a bullish divergence from the recent lows and is slowly climbing. However, it is still below the 55 level, suggesting the uptrend momentum is not yet fully confirmed.
5. Trend Scenarios and Strategic Outlook
Scenario 1: Bullish Continuation
Condition: Price closes above $2,428 and EMA 50.
Next Targets: $3,077 / $3,539 / $4,127
Strategy: Consider long positions on pullbacks above $2,428.
Scenario 2: Sideways Consolidation
Condition: Price remains between $2,026 and $2,850.
Strategy: Range trading — buy near $2,050 and sell near $2,800-$2,850.
Scenario 3: Bearish Breakdown
Condition: Price breaks below $2,026 and EMA 200 decisively.
Downside Targets: $1,650 / $1,500 / $1,376
Strategy: Stay in cash or open short positions with proper risk management.
In this article, we analyze the overall trend of Ethereum (ETH) against the U.S. Dollar (USD) based on the weekly chart using essential technical tools such as trendlines, Fibonacci retracement/extension, moving averages, and key indicators. These tools help identify support and resistance levels, price momentum, and potential medium- to long-term scenarios.
1. Trendline Analysis
In the weekly chart, the trendline shown with a dashed gray line acts as a key resistance. This line is drawn from the early 2024 high around $4,127 to the late 2024 low near $1,376. This downtrend line reflects continued bearish pressure over several months.
Recently, ETH attempted to breach this trendline. Price has touched or hovered around the line a few times, but weekly candles have not decisively closed above it. A confirmed breakout with multiple weekly closes above this trendline would signal a potential shift from a downtrend to an uptrend.
2. Fibonacci Retracement and Extension Analysis
The Fibonacci retracement tool was applied from the low of $1,376 to the high of $4,127. Key levels are:
0.236 (~$2,026): First major support level after a significant pullback. ETH bounced strongly from here.
0.382 (~$2,428): Current key resistance where price is consolidating. A close above this level would open the path to higher targets.
0.618 (~$3,077): A popular target level in bullish retracements.
1.0 (~$4,127): The previous cycle high. A breakout here would establish a Higher High pattern.
Extension levels (1.272, 1.618, 2.0): Used to project long-term bullish targets beyond the previous high. These lie at $4,875 / $5,828 / $6,878 respectively.
3. Moving Averages (EMA) Analysis
The chart features Exponential Moving Averages:
EMA 10-week (yellow): Tracks short-term trends. Currently flattening.
EMA 50-week (purple): Serves as a medium-term resistance. Price is hovering near this level.
EMA 200-week (white): A long-term structural support. ETH remains above this, indicating it has not yet entered a full bearish market phase.
Holding above the EMA 200 is a positive structural sign, while the flattening of EMA 10 may hint at short-term buying exhaustion.
4. Indicator Analysis
Stochastic RSI: Currently in the Overbought zone with a bearish crossover, indicating a possible short-term pullback.
RSI (Relative Strength Index): Formed a bullish divergence from the recent lows and is slowly climbing. However, it is still below the 55 level, suggesting the uptrend momentum is not yet fully confirmed.
5. Trend Scenarios and Strategic Outlook
Scenario 1: Bullish Continuation
Condition: Price closes above $2,428 and EMA 50.
Next Targets: $3,077 / $3,539 / $4,127
Strategy: Consider long positions on pullbacks above $2,428.
Scenario 2: Sideways Consolidation
Condition: Price remains between $2,026 and $2,850.
Strategy: Range trading — buy near $2,050 and sell near $2,800-$2,850.
Scenario 3: Bearish Breakdown
Condition: Price breaks below $2,026 and EMA 200 decisively.
Downside Targets: $1,650 / $1,500 / $1,376
Strategy: Stay in cash or open short positions with proper risk management.
Disclaimer
The information and publications are not meant to be, and do not constitute, financial, investment, trading, or other types of advice or recommendations supplied or endorsed by TradingView. Read more in the Terms of Use.
Disclaimer
The information and publications are not meant to be, and do not constitute, financial, investment, trading, or other types of advice or recommendations supplied or endorsed by TradingView. Read more in the Terms of Use.