This is my over the weekend analysis, not a final recommendation.
Setup Type: Mean Reversion / Absorption Bounce
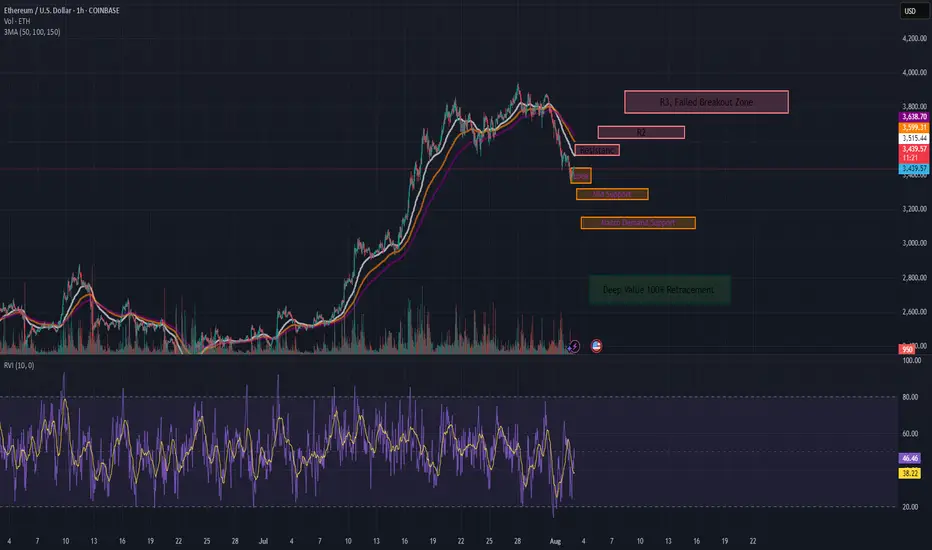
- Trend: Still bearish on 1H (below 50/100/150 MAs), but slope compression hints at weakening
momentum
- RVI: Below 50, but curling up → early bounce bias
- Volume: Sellers fading into $3,440 = buyer absorption zone
📊 1hr Quant Entry Levels & Laddered Plan
Zone Type Action
$3,440–3,435 Primary Entry Base long entry zone 🔄
$3,420–3,410 Add-on Entry Optional bid stack 🧱
$3,320 Soft Invalidation Trend continuation if lost 🚫
$3,150 Deep Value Wick Low-prob, high-juice trap 💎
🎯 Targets:
T1: $3,515 → EMA cluster rejection zone
T2: $3,600–3,638 → Range midpoint
T3: $3,800 → Trend reversal if reclaimed
⚖️ Risk/Reward: 1:2.5+ (depends on fill ladder)
We are starting entries here, but be cautious if we break through our support levels and you don't have the appetite for the deep value range it may be wiser to wait for a confirming trend or post.
Trade active
Resistance zone holding for now. I still have a bearish bias on the hourly since theirs still a few key levels to break.Trading Plan:
-Take profits now in R1 to secure funds. If Overnight and U.S open remain bullish I'd say we could test R2 this week where you can take more if you have a more bullish bias.
-If BTC or the general U.S market is soft tomorrow and we do not test either of these upper levels (mainly R2) by Wednesday night I would wait to repurchase at lower demand zones.
If anyone's interested I can update this post with new levels, or short term levels (like 15m, 5m) for you price action and day traders.
Trade closed: target reached
📢 The T2 target zone ($3,600–3,638) was clearly tagged, and today's price is currently holding as a bullish flip
Original setup:
- The 1‑hour chart had been in steady downtrend, but strong absorption was identified around $3,440 support.
- Mean‑reversion bounce setup, with T2 as the range midpoint — now fully realized.
Since price has reclaimed the midpoint, we can expect support/resistance flips:
- The T2 zone (3,600–3,638) may now serve as support if price holds above.
- A drop below $3,600 could flip that zone back into resistance.
🧭 What To Expect Next
- If ETH holds above $3,638, the bounce could extend toward T3 near $3,800.
- If it retests and breaks back below the 3,600–3,638 zone, the prior resistance may flip and attract fresh selling pressure.
Get Free Alpha, and alerts, signals. Just starting to build a community t.co/zml5QQcbO1
Related publications
Disclaimer
The information and publications are not meant to be, and do not constitute, financial, investment, trading, or other types of advice or recommendations supplied or endorsed by TradingView. Read more in the Terms of Use.