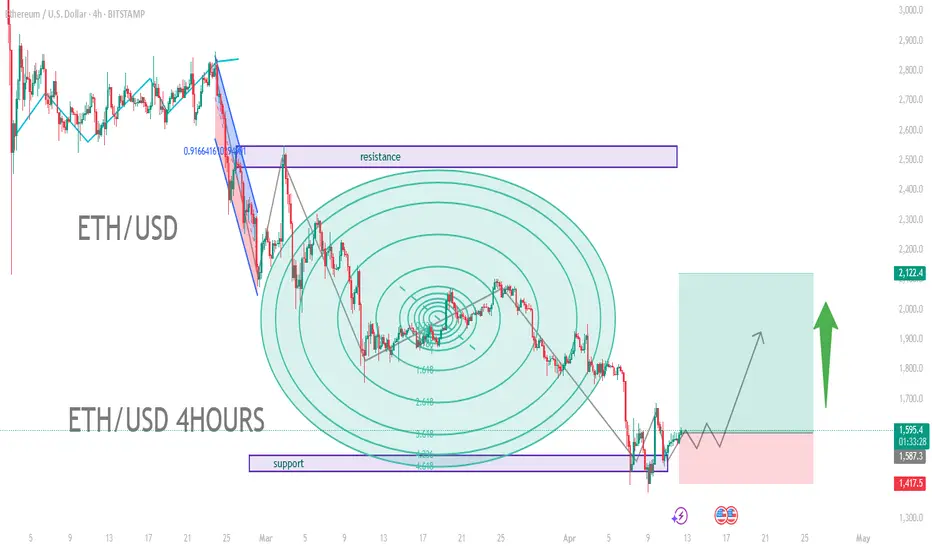
ETH/USD (Ethereum vs. US Dollar)
4-hour chart, meaning each candle represents 4 hours of trading activity.
2. Key Chart Features
Support and Resistance Zones:
Resistance: A rectangular box near the $2,600 to $2,800 price zone. This area previously acted as a ceiling where price was rejected.
Support: A box near the $1,700–$1,750 region. Price has bounced off this area, suggesting a strong demand zone.
Fibonacci Circles:
These concentric circles are used to project potential support/resistance levels and timing based on Fibonacci ratios.
The price seems to be reacting near some of these circle lines, which are drawn from a major swing high to swing low.
Price Action:
There was a strong downward movement (highlighted in blue) followed by a consolidation.
A potential bullish reversal is indicated on the right, with a possible breakout to the upside shown by the green arrow and price projection box.
Risk/Reward Setup:
A long trade setup is illustrated:
Entry around $1,800
Stop loss near $1,417.5
Target around $2,100 or higher
This reflects a bullish outlook with an upward price trajectory.
3. Indicators and Tools Used
Fibonacci Retracement and Fibonacci Circles
Price Action Zones (Support/Resistance)
Projection arrows and rectangular zone for trade visualization
Trade active
200 pips runing in profitDisclaimer
The information and publications are not meant to be, and do not constitute, financial, investment, trading, or other types of advice or recommendations supplied or endorsed by TradingView. Read more in the Terms of Use.
Disclaimer
The information and publications are not meant to be, and do not constitute, financial, investment, trading, or other types of advice or recommendations supplied or endorsed by TradingView. Read more in the Terms of Use.