May be market bullish in upside .
📈 Trade Setup :
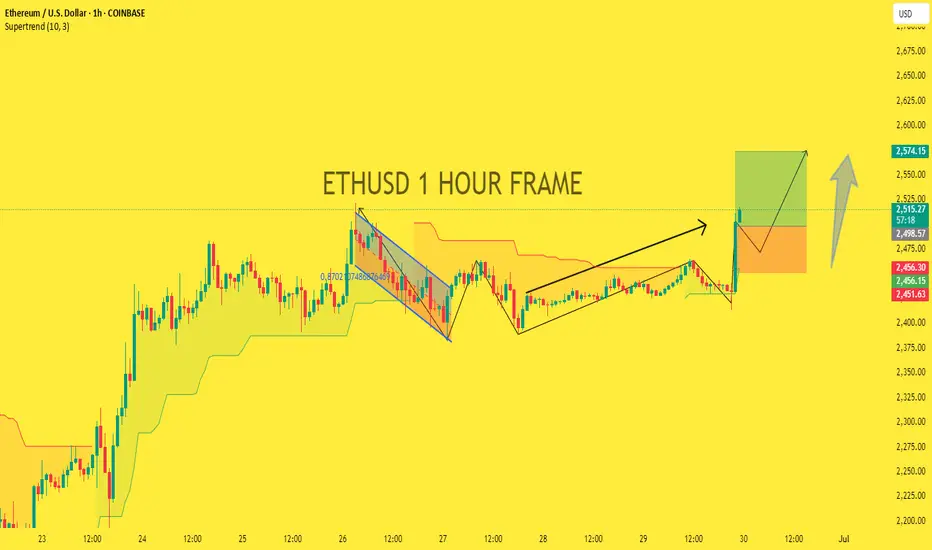
Entry Point: Around current price ~$2,502 - Take-Profit Target: ~$2,574 (marked with green box) - Stop-Loss Level: ~$2,456 (bottom of red box)
🧠 Technical Pattern Analysis
1. Bullish Flag Formation (left side of the chart):
A flagpole (sharp price increase), followed by a downward-sloping consolidation. Classic bullish continuation pattern. Confirmed breakout with upward movement.
2. Second Bull Flag / Channel Pattern (middle of the chart):
Repeated similar structure, with price consolidation forming another flag. Breakout follows after accumulation.
3. Ascending Support Line:
Series of higher lows leading into current price. Suggests bullish sentiment.
✅ Bullish Signals
•Breakout from consolidation
•Strong volume spike at breakout point
•Supertrend flipped to bullish
•Projected path suggests further upside (arrow continuation to top right)
📈 Trade Setup :
Entry Point: Around current price ~$2,502 - Take-Profit Target: ~$2,574 (marked with green box) - Stop-Loss Level: ~$2,456 (bottom of red box)
🧠 Technical Pattern Analysis
1. Bullish Flag Formation (left side of the chart):
A flagpole (sharp price increase), followed by a downward-sloping consolidation. Classic bullish continuation pattern. Confirmed breakout with upward movement.
2. Second Bull Flag / Channel Pattern (middle of the chart):
Repeated similar structure, with price consolidation forming another flag. Breakout follows after accumulation.
3. Ascending Support Line:
Series of higher lows leading into current price. Suggests bullish sentiment.
✅ Bullish Signals
•Breakout from consolidation
•Strong volume spike at breakout point
•Supertrend flipped to bullish
•Projected path suggests further upside (arrow continuation to top right)
Trade closed: stop reached
Sorry guys Stop Loss hit .Ready for next target.Best Analysis xauusd single
t.me/+SAB5y_Kpm8RjYjlk
VIP PREMIMUM ANALYSIS ROOM SIGNALS
t.me/+SAB5y_Kpm8RjYjlk
t.me/+SAB5y_Kpm8RjYjlk
VIP PREMIMUM ANALYSIS ROOM SIGNALS
t.me/+SAB5y_Kpm8RjYjlk
Disclaimer
The information and publications are not meant to be, and do not constitute, financial, investment, trading, or other types of advice or recommendations supplied or endorsed by TradingView. Read more in the Terms of Use.
Best Analysis xauusd single
t.me/+SAB5y_Kpm8RjYjlk
VIP PREMIMUM ANALYSIS ROOM SIGNALS
t.me/+SAB5y_Kpm8RjYjlk
t.me/+SAB5y_Kpm8RjYjlk
VIP PREMIMUM ANALYSIS ROOM SIGNALS
t.me/+SAB5y_Kpm8RjYjlk
Disclaimer
The information and publications are not meant to be, and do not constitute, financial, investment, trading, or other types of advice or recommendations supplied or endorsed by TradingView. Read more in the Terms of Use.