Daily, Log chart
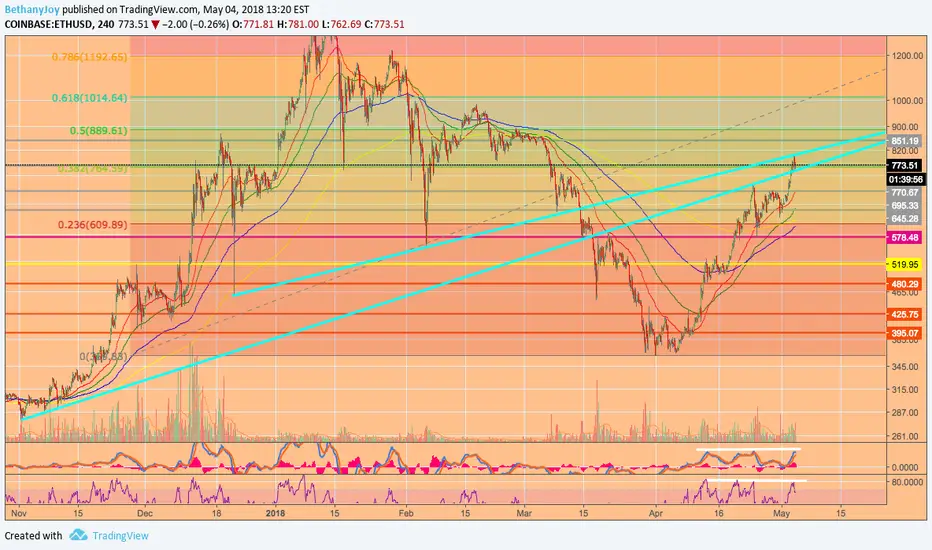
Pay special attention to the two bright blue mid-to-long term ascending, wedging trend lines. We kissed each of them and didn't get rejected outright...perhaps upper resistance is merely playing hard to get. We are currently nestled between them. It certainly is a bullish sign that we clung to this level after such a climb.
After breaking out of a triangle a couple days ago and confirming that line as support, we managed to climb above and hold the .382 retrace of the swing from ATH to low, so far. If we can't hold this line right now, I see us retesting the descending line plotted from the high at 980 and 710, currently down around 670, if we don't bounce from historical s/r at 695 first
Upside target 850-890 range, top end of that range being the .5 fib.
If we can pop over the top blue line, consider a long.
If we lose the .382 and the lower blue line, consider a short.
Maybe even open one of each, if you're feeling fancy, with stops just outside of the blue line territory in either direction, so you don't miss the move.
If you're following this analysis, keep your stops tight. ETH is a wild child and she has fooled me before.
Also, RSI is oversold, beware of a potential flash crash fake-out scenario to reset that.
....I love this analysis, how the price plays with the blue lines and the fibs is so beautiful!
Thanks for taking a look at my charts. Feedback is appreciated!
Measure twice, cut once.
May all of life's treasures be yours.
Note
I forgot I switched this to 4hr view right before publlishing, for clarity of hits to the trendlines. Not daily chart.Note
currently testing the upper blue line as support on the hourlyDisclaimer
The information and publications are not meant to be, and do not constitute, financial, investment, trading, or other types of advice or recommendations supplied or endorsed by TradingView. Read more in the Terms of Use.
Disclaimer
The information and publications are not meant to be, and do not constitute, financial, investment, trading, or other types of advice or recommendations supplied or endorsed by TradingView. Read more in the Terms of Use.