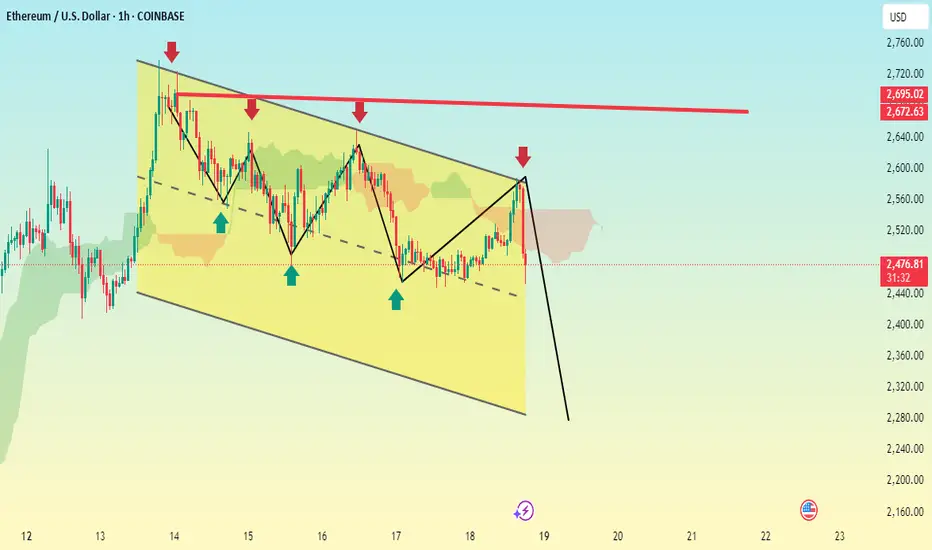
Based on the chart we provided, which shows a descending channel and a bearish pattern on Ethereum (ETH/USD) on the 1-hour timeframe, it seems like you're anticipating a breakdown from the channel support. The chart also shows a projected drop with a strong bearish move marked by a thick black arrow.
Here are some potential Take Profit (TP) levels based on technical support zones and the chart structure:
Suggested Sell TPs (short position):
1. TP1: $2,420 — Just above the recent swing low, potential initial support.
2. TP2: $2,360 — Mid-range of the previous low and psychological level.
3. TP3: $2,300 — Near the bottom of the descending channel and a likely target if breakdown confirms.
4. TP4: $2,240–$2,200 — Extended TP if momentum is strong and the broader market supports the move.
Always remember:
Use proper risk management.
Monitor volume and market sentiment around the breakout.
Consider setting a stop loss just above the recent swing high (around $2,565–$2,580).
Trade active
Target 1&2 hit 2420 and 2360 reached 2340 160 pips
📲 Join telegram channel free ..
t.me/docter_Pips_official05
Forex, Gold & Crypto Signals with detailed analysis & get consistent results..
t.me/docter_Pips_official05
Gold Signal's with proper TP & SL for high profit.
t.me/docter_Pips_official05
Forex, Gold & Crypto Signals with detailed analysis & get consistent results..
t.me/docter_Pips_official05
Gold Signal's with proper TP & SL for high profit.
Disclaimer
The information and publications are not meant to be, and do not constitute, financial, investment, trading, or other types of advice or recommendations supplied or endorsed by TradingView. Read more in the Terms of Use.