Current Situation
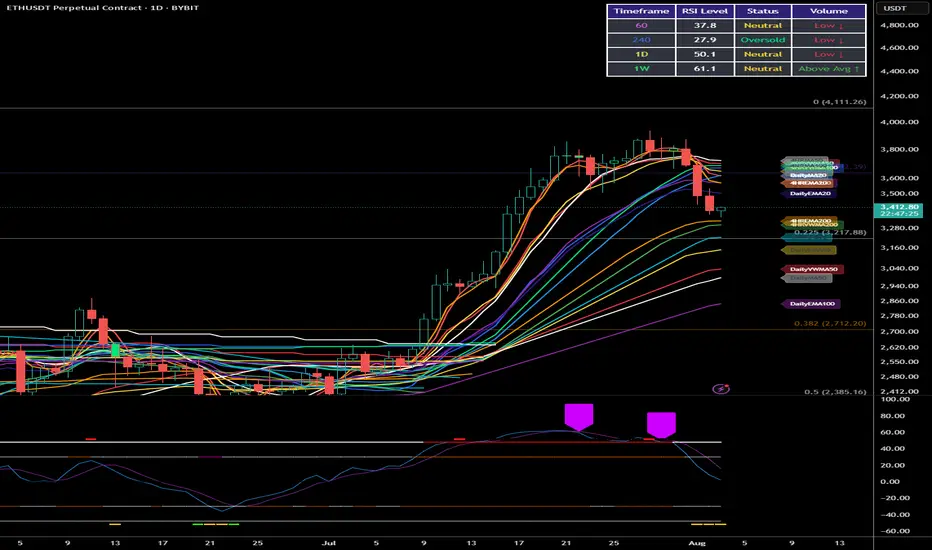
Ethereum has been on quite a journey in 2025. After climbing steadily since January and reaching nearly $4,000 in July, we're now seeing a pullback with prices around $3,400. This isn't unusual - even in strong uptrends, prices don't move in straight lines.
What The Data Tells Us
Looking at the price patterns and technical indicators:
The big picture remains positive: Despite recent dips, Ethereum is still in an uptrend when looking at the longer timeframe. We're significantly higher than where we started the year.
We're at a decision point: The price is currently sitting at an important level where buyers and sellers have previously shown strong interest.
Support and resistance zones are clear: There have been consistent price levels where Ethereum tends to bounce (support) or struggle to break through (resistance).
Three Possible Paths Forward
Path 1: Resuming the Climb (45% likelihood)
If buyers regain control, we could see Ethereum push back above $3,500, then challenge the recent highs near $3,900. Breaking that level could open the door to the psychologically important $4,000 mark and potentially beyond.
Path 2: Further Pullback (40% likelihood)
If selling pressure continues, Ethereum might drop toward $3,200 first, with stronger support around $3,000. In a deeper correction scenario, we could test the $2,800 area where many buyers stepped in during previous dips.
Path 3: Sideways Movement (15% likelihood)
Sometimes markets need time to digest gains. Ethereum could spend several weeks trading sideways between roughly $3,300 and $3,600 before making its next significant move.
What To Watch For
Breakout signals: A strong move above $3,550 with increasing trading volume would suggest the uptrend is resuming.
Breakdown signals: Falling below $3,350 with conviction could indicate more downside ahead.
Volume patterns: Higher volume on up-days versus down-days would suggest stronger buyer interest.
This analysis is based purely on price patterns and technical indicators, looking at what the market has actually done rather than predictions based on news or sentiment.
Discord.gg/CryptoIndicators
Disclaimer
The information and publications are not meant to be, and do not constitute, financial, investment, trading, or other types of advice or recommendations supplied or endorsed by TradingView. Read more in the Terms of Use.
Discord.gg/CryptoIndicators
Disclaimer
The information and publications are not meant to be, and do not constitute, financial, investment, trading, or other types of advice or recommendations supplied or endorsed by TradingView. Read more in the Terms of Use.