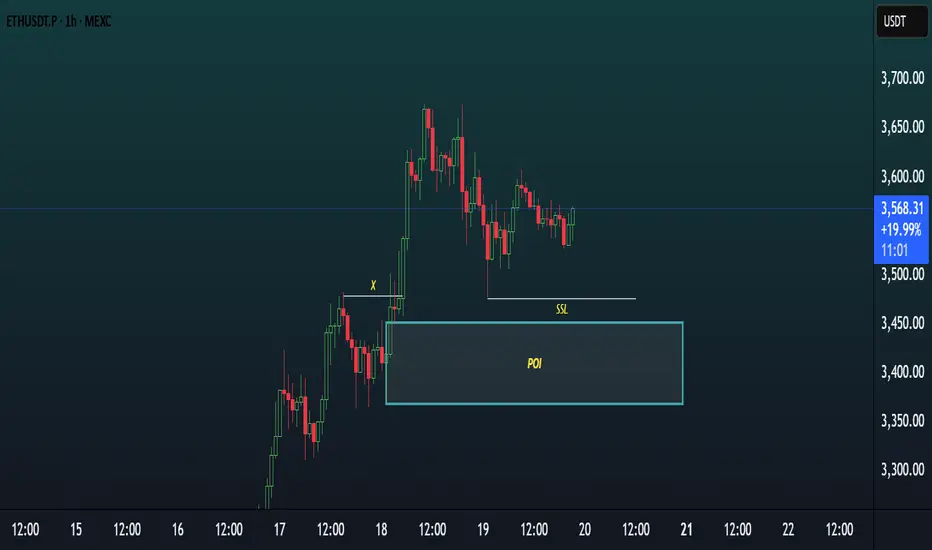
This chart showcases a Smart Money Concepts (SMC) style analysis on the 1-hour timeframe of ETHUSDT.P, focusing on a potential bullish setup.
Key Elements:
POI (Point of Interest)
A demand zone is clearly marked around the $3,400–$3,460 area, highlighted as a potential reversal zone where price may react bullishly.
SSL (Sell-Side Liquidity)
Sell-side liquidity has been swept below a recent low, indicating a possible liquidity grab before a reversal.
X (Previous Break of Structure)
Point “X” marks a significant BOS (Break of Structure) indicating bullish intent in prior price action.
Current Price Action
Price recently tapped into the POI, swept SSL, and is now consolidating slightly above the zone — suggesting accumulation or preparation for a bullish move.
Bias:
Bullish — Expecting a possible reversal or continuation to the upside after liquidity sweep and POI mitigation.
Disclaimer
The information and publications are not meant to be, and do not constitute, financial, investment, trading, or other types of advice or recommendations supplied or endorsed by TradingView. Read more in the Terms of Use.
Disclaimer
The information and publications are not meant to be, and do not constitute, financial, investment, trading, or other types of advice or recommendations supplied or endorsed by TradingView. Read more in the Terms of Use.