Hello, traders.
If you "Follow", you can always get new information quickly.
Please also click "Boost".
Have a nice day today.
-------------------------------------
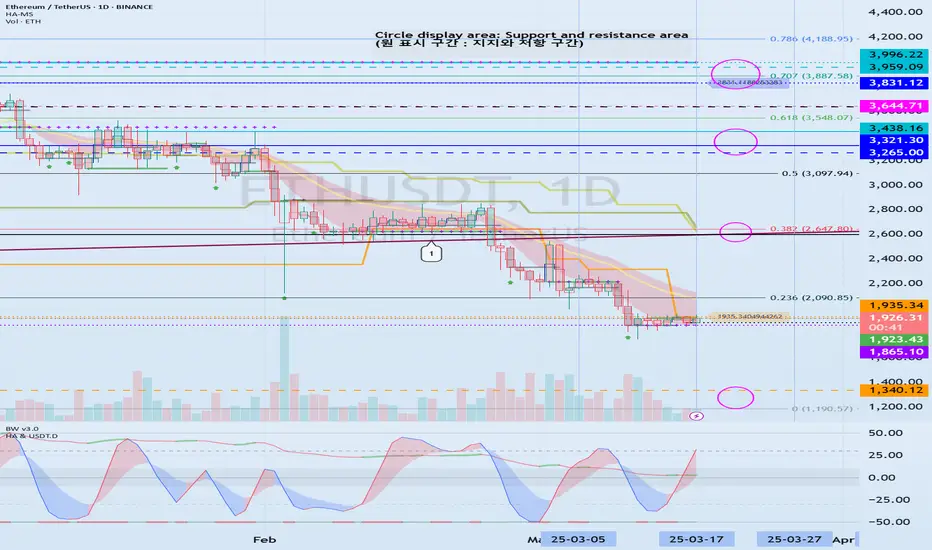
(ETHUSDT 1D chart)
The important support and resistance zones have changed as it has fallen below the long-term upward trend line (1).
After March 18, the key is whether ETH can maintain its price by receiving support near 1935.34 and rising above the M-Signal indicator on the 1D chart, that is, the Fibonacci ratio of 0.236 (2090.85).
If it falls after receiving resistance near 1935.34, it is possible that it will fall to around 1340.12, so you should also consider a response plan for this.
-
In order to turn into an uptrend, the price must rise above the M-Signal indicator on the 1M chart and maintain it.
To do so, the price must be maintained near the Fibonacci ratio of 0.382 (2647.80).
-
Therefore, if it rises after receiving support near 1935.34,
1st: M-Signal on the 1D chart (Fibonacci ratio of 0.236 (2090.85))
2nd: M-Signal on the 1M chart (Fibonacci ratio of 0.382 (2647.80))
You should respond depending on whether there is support near the 1st and 2nd above.
Currently, the StochRSI indicator is showing signs of entering the overbought zone, so even if there is an additional rise, it is expected to eventually show a downward trend.
In order to ignore this law, an explosive trading volume or favorable market news is required.
-
(30m chart)
Since the StochRSI indicator is in the oversold zone, it is highly likely to rise even if it continues to fall further.
However, since it is a 30m chart, you should respond based on day trading or short-term trading.
Since the HA-High (1936.67) indicator and the BW (100) (1944.96) indicator are located near 1935.34, we can see that it is forming a resistance zone.
Therefore, even if there is an additional rise, it seems likely to be resisted in this resistance zone (1936.67-1944.96).
If it falls below 1923.43,
1st: Heikin Ashi's Close on the 1D chart
2nd: HA-Low indicator (1885.30)
3rd: 1865.10
We need to check if it is supported near the 1st-3rd above.
-
Therefore, if it is supported and rises near 1935.34,
1st: M-Signal on 1D chart (Fibonacci ratio 0.236 (2090.85))
2nd: M-Signal on 1M chart (Fibonacci ratio 0.382 (2647.80))
You need to respond depending on whether there is support near the 1st and 2nd above.
Since the StochRSI indicator is currently showing signs of entering the overbought zone, it is expected that it will eventually show a downward trend even if there is an additional rise.
In order to ignore this law, an explosive trading volume or favorable market conditions must occur.
-
Thank you for reading to the end.
I hope you have a successful trade.
--------------------------------------------------
- Big picture
I used TradingView's INDEX chart to check the entire range of BTC.
(BTCUSD 12M chart)
Looking at the big picture, it seems to have been maintaining an upward trend following a pattern since 2015.
In other words, it is a pattern that maintains a 3-year upward trend and faces a 1-year downward trend.
Accordingly, the upward trend is expected to continue until 2025.
-
(LOG chart)
Looking at the LOG chart, you can see that the upward trend is decreasing.
Accordingly, the 46K-48K range is expected to be a very important support and resistance range from a long-term perspective.
Therefore, we expect that we will not see prices below 44K-48K in the future.
-
The Fibonacci ratio on the left is the Fibonacci ratio of the uptrend that started in 2015.
In other words, it is the Fibonacci ratio of the first wave of the uptrend.
The Fibonacci ratio on the right is the Fibonacci ratio of the uptrend that started in 2019.
Therefore, it is expected that this Fibonacci ratio will be used until 2026.
-
No matter what anyone says, the chart has already been created and is already moving.
How to view and respond to this is up to you.
When the ATH is updated, there are no support and resistance points, so the Fibonacci ratio can be used appropriately.
However, although the Fibonacci ratio is useful for chart analysis, it is ambiguous when used as support and resistance.
This is because the user must directly select the important selection points required to create Fibonacci.
Therefore, since it is expressed differently depending on how the user specifies the selection points, it can be useful for chart analysis, but it can be seen as ambiguous when used for trading strategies.
1st : 44234.54
2nd : 61383.23
3rd : 89126.41
101875.70-106275.10 (Overshooting)
4th : 134018.28
151166.97-157451.83 (Overshooting)
5th : 178910.15
-----------------
Trade active
#ETHUSDTIn the short term, it should be above the M-Signal indicator on the 1D chart.
In the medium to long term, it should rise above the previous Heikin-Ashi Close on the 1W chart and above 2262.94 for the uptrend to begin.
The actual uptrend is likely to begin when it rises above the M-Signal indicator on the 1M chart.
Other content (coins, stocks, etc.) is frequently posted on X.
X에 다른 내용(코인, 주식 등)이 자주 게시됩니다.
◆ t.me/readCryptoChannel
[HA-MS Indicator]
bit.ly/3YxHgvN
[OBV Indicator]
bit.ly/4dcyny3
X에 다른 내용(코인, 주식 등)이 자주 게시됩니다.
◆ t.me/readCryptoChannel
[HA-MS Indicator]
bit.ly/3YxHgvN
[OBV Indicator]
bit.ly/4dcyny3
Related publications
Disclaimer
The information and publications are not meant to be, and do not constitute, financial, investment, trading, or other types of advice or recommendations supplied or endorsed by TradingView. Read more in the Terms of Use.