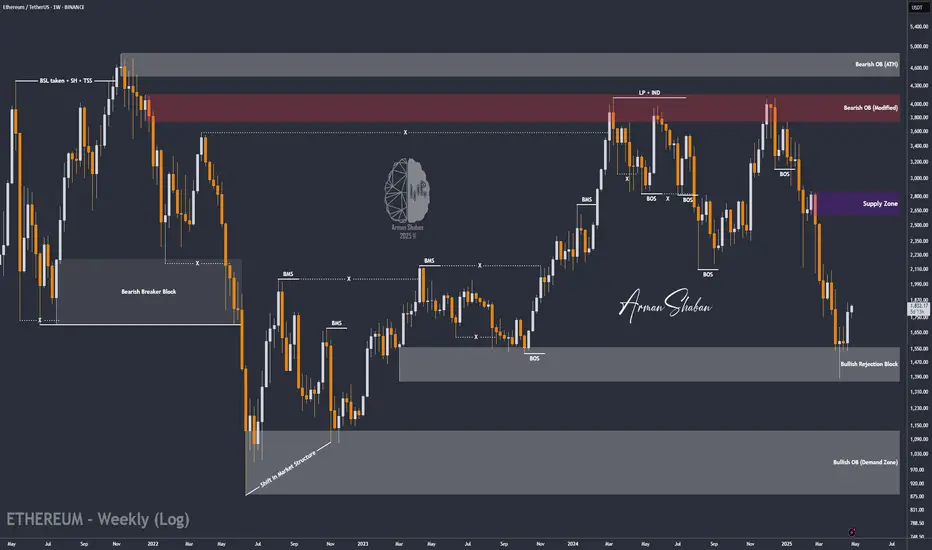
By analyzing the #Ethereum chart on the weekly (logarithmic) timeframe, we can see that after reaching the demand zone between $1400 and $1550, buying pressure increased significantly. Currently, Ethereum is trading around $1800, and I expect to see the next bullish wave soon. The potential upside targets are $1990, $2500, and $2600. This analysis will be updated accordingly!
Please support me with your likes and comments to motivate me to share more analysis with you and share your opinion about the possible trend of this chart with me !
Best Regards , Arman Shaban
Please support me with your likes and comments to motivate me to share more analysis with you and share your opinion about the possible trend of this chart with me !
Best Regards , Arman Shaban
Trade closed: target reached
By analyzing the #Ethereum chart on the weekly (logarithmic) timeframe, we can see that after our last analysis, the price experienced a very strong rally. As you can see, it successfully hit the targets of $1990 and $2500, delivering over 35% return. I hope you made the most out of this analysis and, as always, wish you profitable days ahead, friends!⚜️ Free Telegram Channel : t.me/PriceAction_ICT
⚜️ JOIN THE VIP : t.me/PriceAction_ICT/5946
⚜️ Contact Me : t.me/ArmanShabanTrading
💥Join BitMart Exchange – Ultra Low Fees : bitmart.com/invite/c5JVJK/en-US
⚜️ JOIN THE VIP : t.me/PriceAction_ICT/5946
⚜️ Contact Me : t.me/ArmanShabanTrading
💥Join BitMart Exchange – Ultra Low Fees : bitmart.com/invite/c5JVJK/en-US
Related publications
Disclaimer
The information and publications are not meant to be, and do not constitute, financial, investment, trading, or other types of advice or recommendations supplied or endorsed by TradingView. Read more in the Terms of Use.
⚜️ Free Telegram Channel : t.me/PriceAction_ICT
⚜️ JOIN THE VIP : t.me/PriceAction_ICT/5946
⚜️ Contact Me : t.me/ArmanShabanTrading
💥Join BitMart Exchange – Ultra Low Fees : bitmart.com/invite/c5JVJK/en-US
⚜️ JOIN THE VIP : t.me/PriceAction_ICT/5946
⚜️ Contact Me : t.me/ArmanShabanTrading
💥Join BitMart Exchange – Ultra Low Fees : bitmart.com/invite/c5JVJK/en-US
Related publications
Disclaimer
The information and publications are not meant to be, and do not constitute, financial, investment, trading, or other types of advice or recommendations supplied or endorsed by TradingView. Read more in the Terms of Use.