🔹ETH/USDT – Technical Analysis (4H Chart)
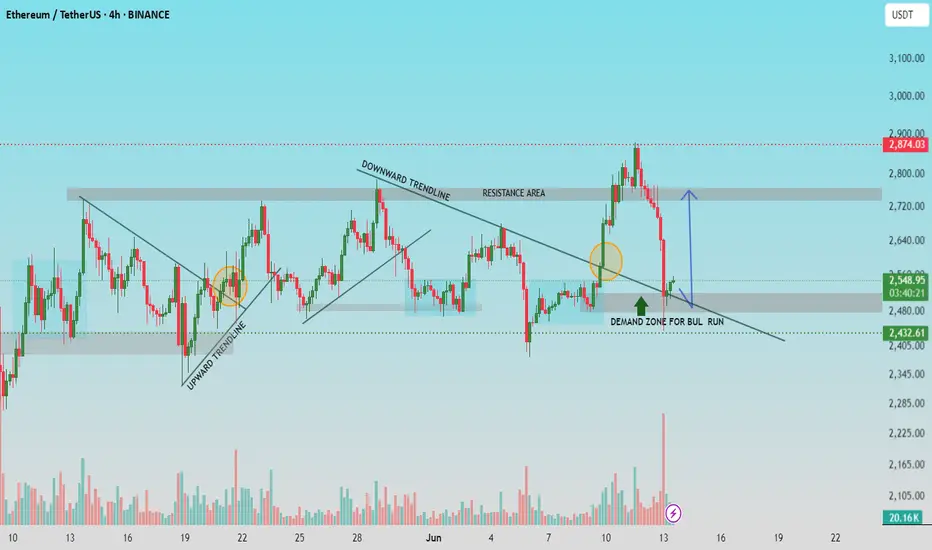
Ethereum recently bounced from a key demand zone around $2,430-$2,480, following a sharp retracement from the $2,870 peak. The pullback respected this zone, aligning with the intersection of a former downward trendline, now acting as support.
🔍 Key Technical Highlights:
▪️ Break and Retest: Price broke above the downward trendline, retested it, and is now attempting a rebound - this confirms a potential bullish continuation.
▪️ Demand Zone Respected: The reaction from the demand area signals buyer interest and market structure preservation.
▪️Volume Spike: Increased volume at the bounce point adds weight to bullish conviction.
🎯 Upside Targets:
▫️ Immediate Resistance: $2,720-$2,750
▫️Final Target Area: $2,870+
📉 Invalidation: A break below $2,430 would invalidate the bullish structure and expose lower support levels.
📈 Bias: Bullish, while price holds above $2,430 and maintains higher low formations. Watch for a clean break above $2,640 to confirm momentum toward resistance zones.
🔹Community Insight:
If you find this analysis helpful in your trading journey, feel free to share your thoughts or questions in the comments. Let’s work together to maintain a disciplined, technical approach to the markets.
▪️Follow for regular updates and trade setups.
Trade active
Note
trade running 120 pips+Related publications
Disclaimer
The information and publications are not meant to be, and do not constitute, financial, investment, trading, or other types of advice or recommendations supplied or endorsed by TradingView. Read more in the Terms of Use.
Related publications
Disclaimer
The information and publications are not meant to be, and do not constitute, financial, investment, trading, or other types of advice or recommendations supplied or endorsed by TradingView. Read more in the Terms of Use.