1. Market Structure and Overall Trend
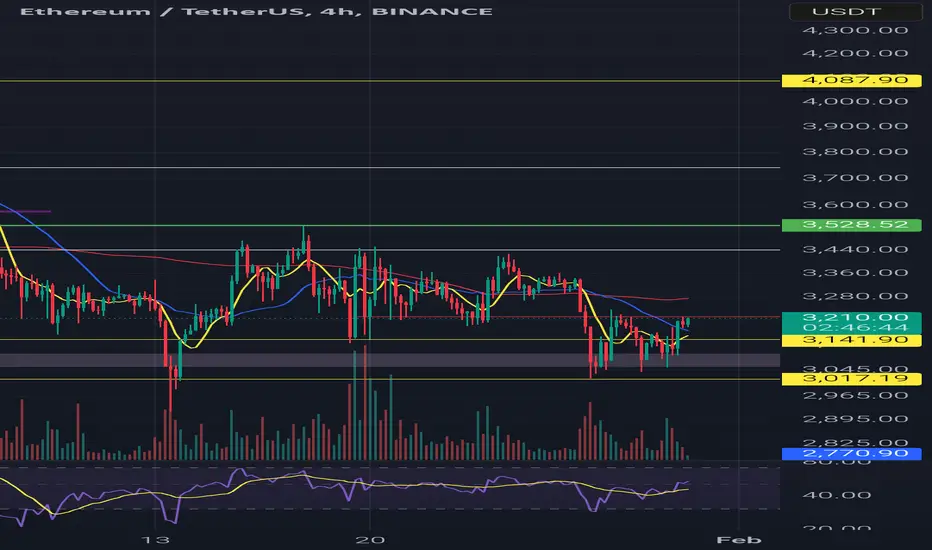
Current Price: 3206.46 USDT
The overall trend in the 4-hour timeframe is bearish, with temporary corrections toward resistance levels.
The price dropped after hitting 3528.52 USDT and is still moving below key moving averages.
2. Key Support and Resistance Levels
Support Levels:
3141.90 USDT (Medium-term support)
3017.19 USDT (Strong support with high probability of reaction)
Resistance Levels:
3206.46 USDT (Current resistance where the price is struggling to break)
3528.52 USDT (Major resistance in the overall trend)
3. Indicator Analysis
Moving Averages (MA):
The price is below the 200-period moving average, indicating selling pressure.
The short-term moving average (blue) is trending downward, confirming weak bullish momentum.
RSI:
RSI is between 40 and 50, showing a balance between buyers and sellers.
If RSI drops below 30, a bullish divergence could signal a potential buy opportunity.
4. Technical Patterns
Bearish Pattern:
A negative divergence at the previous high led to a price drop.
Possible Reversal Pattern:
If the price holds above 3141.90 USDT, a double-bottom pattern may form, pushing the price toward 3300 USDT.
---
Suggested Trading Plan
Long (Buy) Scenario
Entry: If the price stabilizes above 3206 USDT and breaks resistance with a strong confirmation candle.
Stop Loss: Below 3140 USDT (to reduce the risk of a false breakout).
Targets:
First target: 3300 USDT
Second target: 3528 USDT
Short (Sell) Scenario
Entry: If the 3141 USDT support breaks with a strong bearish candle.
Stop Loss: Above 3220 USDT (to avoid being stopped out on a false breakdown).
Targets:
First target: 3070 USDT
Second target: 3017 USDT
Conclusion
A breakout above 3206 USDT could trigger a short-term bullish move.
If 3141 USDT is lost, the price will likely drop to 3017 USDT.
As long as the price remains below the 200-period moving average, the overall trend remains bearish.
⚠ Recommendation: Always wait for confirmation signals before entering a trade and maintain a proper risk-to-reward ratio.
Disclaimer
The information and publications are not meant to be, and do not constitute, financial, investment, trading, or other types of advice or recommendations supplied or endorsed by TradingView. Read more in the Terms of Use.
Disclaimer
The information and publications are not meant to be, and do not constitute, financial, investment, trading, or other types of advice or recommendations supplied or endorsed by TradingView. Read more in the Terms of Use.