🔹 EUR/JPY – 1H Chart Technical Outlook
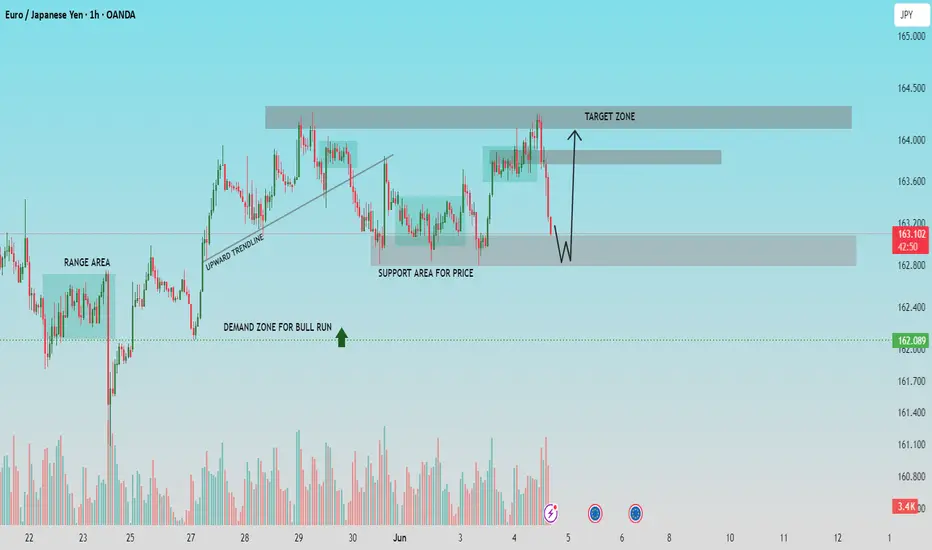
The EUR/JPY pair is currently testing a key support zone around 162.80-163.00 after a sharp drop from the recent high. This zone has acted as a strong base previously, with visible buying interest.
🔹 Market Context:
* Price broke below a short-term consolidation but is now approaching a retest zone, with potential for a bullish reversal.
* A W-pattern structure is developing, indicating possible accumulation before an upward move.
🔹 Key Levels:
* Support Zone: 162.80-163.00
* Demand Zone for Bull Run: 162.00
* Target Zone on Upside: 164.20-164.60
🔹 Projection:
If the support holds and we see bullish confirmation (strong engulfing candle or volume spike), price could rebound toward the target resistance zone near 164.50. A break below 162.80 with strong bearish momentum could invalidate this setup.
🔹 Conclusion:
Monitor for price action signals at current levels. A confirmed rebound from support could offer a high-probability long opportunity toward the 164+ zone.
🔹Community Insight:
If you find this analysis helpful in your trading journey, feel free to share your thoughts or questions in the comments. Let’s work together to maintain a disciplined, technical approach to the markets.
▪️Follow for regular updates and trade setups.
Trade active
Note
Trade closed: target reached
💸FREE FOREX Signals in Telegram : t.me/FxInsightsHub0
🔹Join Our Telegram Channel, Pure Price Action Based Signals With Chart Analysis.
t.me/FxInsightsHub0
🚀FREE CRYPTO Signals In Telegram: t.me/FxInsightsHub0
🔹Join Our Telegram Channel, Pure Price Action Based Signals With Chart Analysis.
t.me/FxInsightsHub0
🚀FREE CRYPTO Signals In Telegram: t.me/FxInsightsHub0
Related publications
Disclaimer
The information and publications are not meant to be, and do not constitute, financial, investment, trading, or other types of advice or recommendations supplied or endorsed by TradingView. Read more in the Terms of Use.