Looking for a long entry, limit order set....
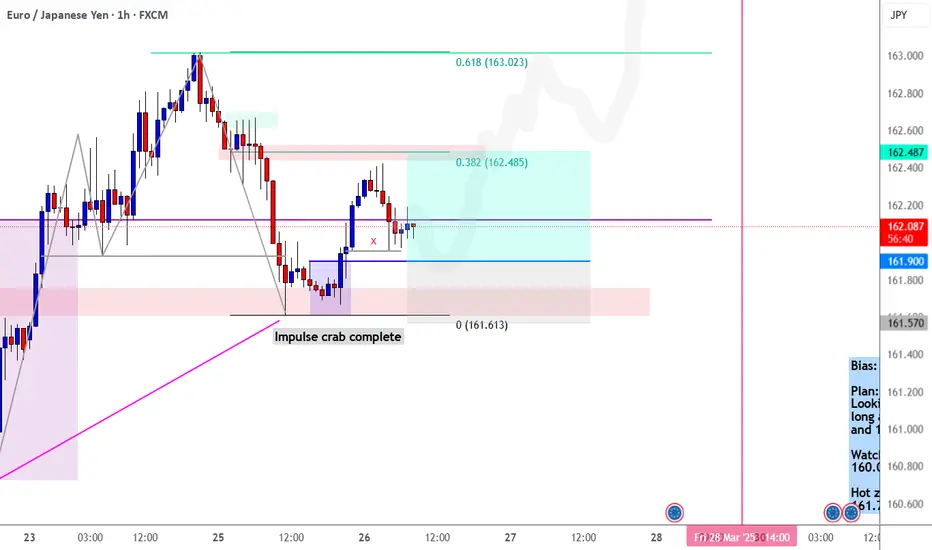
Here is my logic from left to right: we have an short term "double top" forming inside a higher time frame up trend, I'm looking for a run on the stops of traders going short.
My target is the next red zone even though im projecting this pair to go much higher.
Earlier this week in my newsletter, I gave two zones to look for buy reactions in for EURJPY.
(the huge purple zone on the left, and the bottom red zone within it which currently has a +75 pip reaction.)
Feel free to check it out, the link is in my post signature, and profile bio.
Cheers 🍻
Here is my logic from left to right: we have an short term "double top" forming inside a higher time frame up trend, I'm looking for a run on the stops of traders going short.
- We found support at a bullish liquidity pocket (bottom red spot) = Bullish sign
- Price completed a bullish harmonic (that grey double top structure is a harmonic) = Bullish sign
- Price gave me entry signal with H1 break of structure (blue zone) = Bullish sign
- We have equal lows sitting just above the blue line (X's) = Bullish sign
My target is the next red zone even though im projecting this pair to go much higher.
Earlier this week in my newsletter, I gave two zones to look for buy reactions in for EURJPY.
(the huge purple zone on the left, and the bottom red zone within it which currently has a +75 pip reaction.)
Feel free to check it out, the link is in my post signature, and profile bio.
Cheers 🍻
Note
Target hit, no entry givenDisclaimer
The information and publications are not meant to be, and do not constitute, financial, investment, trading, or other types of advice or recommendations supplied or endorsed by TradingView. Read more in the Terms of Use.
Disclaimer
The information and publications are not meant to be, and do not constitute, financial, investment, trading, or other types of advice or recommendations supplied or endorsed by TradingView. Read more in the Terms of Use.