Hello traders! Happy Friday — hope you're closing the week strong.
Let’s break down this clean ABC Bearish pattern on EURJPY from the 1H chart.
📍 Structure Breakdown
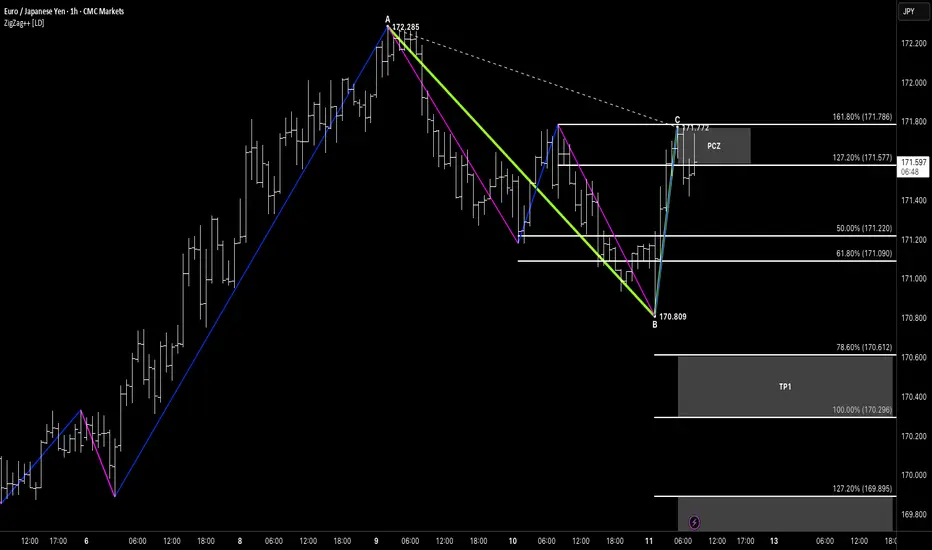
We’re looking at a sharp A to B decline followed by a corrective rally into point C.
Point C completes just under the previous swing high, creating a potential lower high setup.
Price has reacted from this level and is now pushing lower, confirming bearish momentum.
🎯 Target Zones
We’ve projected the AB leg from point C to define a measured move:
TP1: 170.29 (100%)
TP2: 169.89 (127.2%)
Final extension at 169.38 (161.8%) offers additional confluence
Note how the TP1 zone aligns with prior structure levels and the 78.6% extension — offering a clean reaction area.
🧠 Pattern Notes
ABC symmetry-based projection
Bearish impulse > corrective rally structure
Potential for deeper extension if TP1 breaks
Beautiful example of structure-followed geometry
Let’s break down this clean ABC Bearish pattern on EURJPY from the 1H chart.
📍 Structure Breakdown
We’re looking at a sharp A to B decline followed by a corrective rally into point C.
Point C completes just under the previous swing high, creating a potential lower high setup.
Price has reacted from this level and is now pushing lower, confirming bearish momentum.
🎯 Target Zones
We’ve projected the AB leg from point C to define a measured move:
TP1: 170.29 (100%)
TP2: 169.89 (127.2%)
Final extension at 169.38 (161.8%) offers additional confluence
Note how the TP1 zone aligns with prior structure levels and the 78.6% extension — offering a clean reaction area.
🧠 Pattern Notes
ABC symmetry-based projection
Bearish impulse > corrective rally structure
Potential for deeper extension if TP1 breaks
Beautiful example of structure-followed geometry
Note
Note
EURJPY – SYMMETRY SETUP & A LESSON FROM THE HIGHER TIMEFRAME PERSPECTIVEHello traders, I hope you're enjoying a peaceful weekend and reflecting on the trading week.
Let’s walk through an insightful EURJPY sequence from this past Friday that offered a beautiful real-time lesson:
On the 1-hour chart, price formed what looked like a classic ABC Bearish structure, triggering interest in the PCZ (Potential Completion Zone) for shorts. The confluence of the 127.2% and 161.8% Fibonacci extensions looked compelling for a short setup, and the symmetry with previous swings added further weight.
Price tapped the PRZ... but didn’t confirm.
However, switching to the 2-hour timeframe, a clearer picture emerged.
There we can see a clean symmetry structure, where price completed an XABCD style retracement and held firm on a previous 100% expansion into support, creating a strong bullish reversal zone.
The pattern held, price reversed impulsively from the PRZ, and no valid bearish confirmation followed.
🔍 Key Takeaway:
Always honor the higher timeframe structure. This was a textbook example of an operator mistake – not the fault of the pattern or the market, but of getting too granular and missing the broader geometry.
📌 Lesson Learned:
Never let lower timeframes talk you out of a higher timeframe conviction. If there’s a confluence of symmetry, structure, and reaction, stay aligned with that bigger narrative. The market rarely lies—but it does whisper first on the higher frames.
Happy weekend to all – see you back Monday recharged, focused, and ready.
#TradeChartPatternsLikeThePros #EURJPY #Symmetry #ABCbearish #OperatorError #LessonLearned #HigherTimeframeFirst #PatternDiscipline #TradingPsychology #WeekendReflections
Disclaimer
The information and publications are not meant to be, and do not constitute, financial, investment, trading, or other types of advice or recommendations supplied or endorsed by TradingView. Read more in the Terms of Use.
Disclaimer
The information and publications are not meant to be, and do not constitute, financial, investment, trading, or other types of advice or recommendations supplied or endorsed by TradingView. Read more in the Terms of Use.