1D Timeframe: The daily chart shows a strong bullish momentum with a series of green candles indicating a clear uptrend. This suggests institutional buying pressure and a lack of significant sell-side resistance.
4H Timeframe: The 4-hour chart presents a more consolidated view with price action oscillating around the 1.17200 level. This could indicate a phase of distribution or accumulation as institutions prepare for the next significant move.
1H Timeframe: The hourly chart shows a similar consolidation pattern with slight bullish bias as evidenced by the recent green candles. This could be a preparation phase before a potential liquidity sweep.
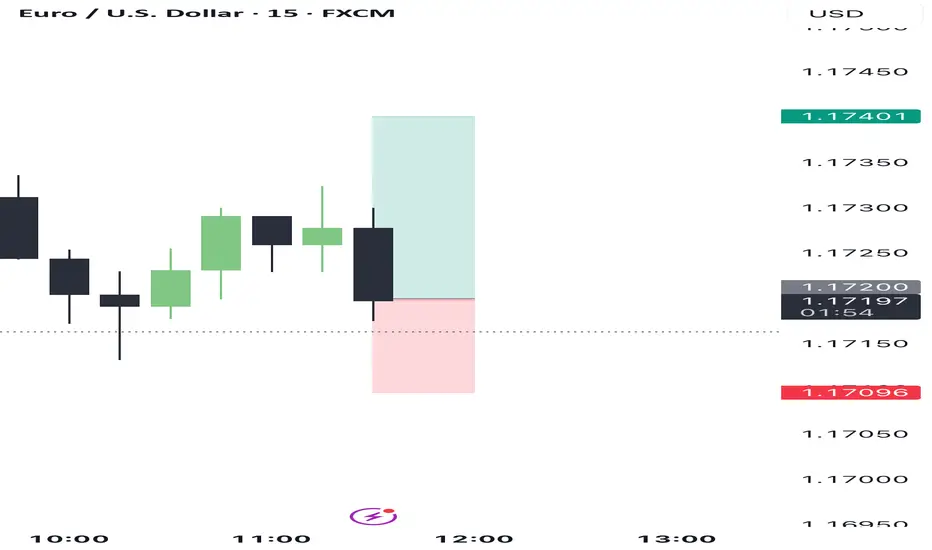
15M Timeframe: The 15-minute chart shows more volatility with price testing both higher and lower bounds around the central consolidation zone. This indicates active trading and potential setup for stop hunts.
5M Timeframe: On the 5-minute chart, there is a visible decline, suggesting a potential liquidity grab as price dips below the consolidation zone, possibly trapping late retail sellers.
1M Timeframe: The 1-minute chart shows a sharp drop followed by a quick recovery, indicative of a stop hunt or liquidity sweep, confirming the potential trap seen on the 5-minute chart.
INSTITUTIONAL THESIS:
Institutions appear to be in a phase of accumulation after a liquidity sweep, particularly visible on the lower timeframes. The recent sharp movements on the 1-minute and 5-minute charts suggest a trapping of retail positions, setting the stage for a potential bullish continuation.
LEARNING POINT:
"1M and 5M liquidity sweep and trapping of retail sellers before potential bullish continuation."
4H Timeframe: The 4-hour chart presents a more consolidated view with price action oscillating around the 1.17200 level. This could indicate a phase of distribution or accumulation as institutions prepare for the next significant move.
1H Timeframe: The hourly chart shows a similar consolidation pattern with slight bullish bias as evidenced by the recent green candles. This could be a preparation phase before a potential liquidity sweep.
15M Timeframe: The 15-minute chart shows more volatility with price testing both higher and lower bounds around the central consolidation zone. This indicates active trading and potential setup for stop hunts.
5M Timeframe: On the 5-minute chart, there is a visible decline, suggesting a potential liquidity grab as price dips below the consolidation zone, possibly trapping late retail sellers.
1M Timeframe: The 1-minute chart shows a sharp drop followed by a quick recovery, indicative of a stop hunt or liquidity sweep, confirming the potential trap seen on the 5-minute chart.
INSTITUTIONAL THESIS:
Institutions appear to be in a phase of accumulation after a liquidity sweep, particularly visible on the lower timeframes. The recent sharp movements on the 1-minute and 5-minute charts suggest a trapping of retail positions, setting the stage for a potential bullish continuation.
LEARNING POINT:
"1M and 5M liquidity sweep and trapping of retail sellers before potential bullish continuation."
Disclaimer
The information and publications are not meant to be, and do not constitute, financial, investment, trading, or other types of advice or recommendations supplied or endorsed by TradingView. Read more in the Terms of Use.
Disclaimer
The information and publications are not meant to be, and do not constitute, financial, investment, trading, or other types of advice or recommendations supplied or endorsed by TradingView. Read more in the Terms of Use.