Currency Pair & Timeframe
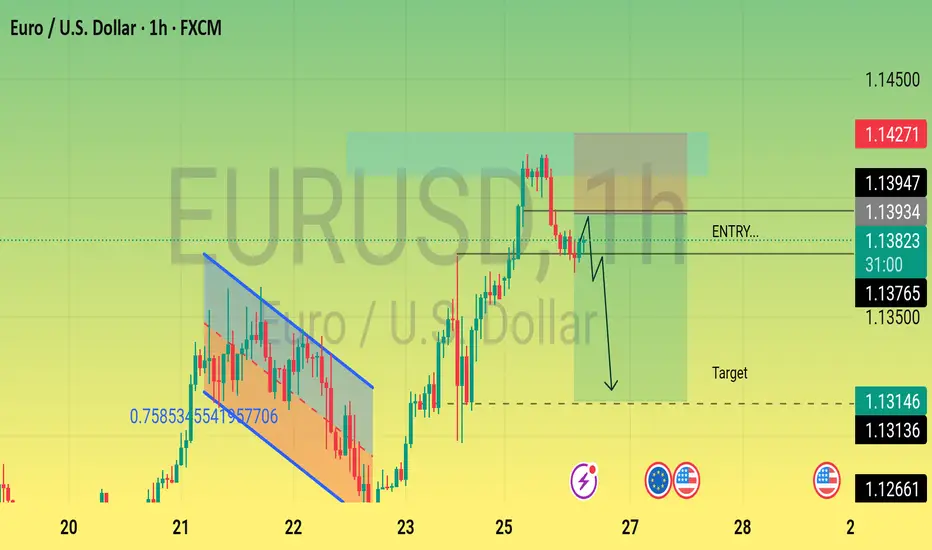
Instrument: EUR/USD (Euro vs US Dollar)
Timeframe: 1 Hour (each candle = 1 hour of price movement)
---
2. Chart Patterns Identified
Falling Wedge Pattern (blue lines):
A bullish reversal pattern seen between May 21–22. After the breakout from this wedge, the price surged upward.
---
3. Entry Point
Marked “ENTRY” Line at 1.13827:
This is the suggested level where a short (sell) position could be initiated.
---
4. Price Target
Target Zone near 1.13146:
Based on the expected price movement after entry, the target for taking profit lies around this area.
---
5. Expected Price Action (Black Arrows)
The chart predicts a possible rejection from the current level and a drop toward the target.
The black zigzag arrow shows a pullback followed by a sharp downward move.
---
6. Key Price Levels (Right Side)
1.14271 – Possible stop-loss zone (if price moves above this level, the trade may be invalid).
1.13947 & 1.13934 – Resistance zones.
1.13827 – Entry point.
1.13146 & 1.13136 – Profit target zones.
1.12661 & 1.12500 – Stronger support areas (price may reverse from here).
---
7. News Indicators (Flags at Bottom)
Euro & US Flags:
Indicate upcoming economic news events for the Euro and the US Dollar which may increase volatility.
Disclaimer
The information and publications are not meant to be, and do not constitute, financial, investment, trading, or other types of advice or recommendations supplied or endorsed by TradingView. Read more in the Terms of Use.
Disclaimer
The information and publications are not meant to be, and do not constitute, financial, investment, trading, or other types of advice or recommendations supplied or endorsed by TradingView. Read more in the Terms of Use.