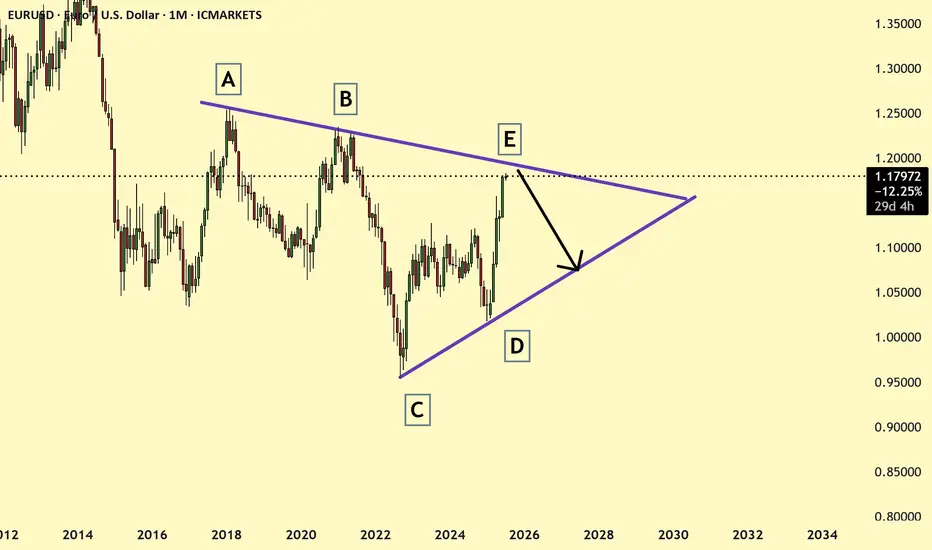
EURUSD monthly pattern showing price reaching the symmetrical triangle resistance and currently price is nearing the resistance and may soon the price may reverse and look for the reversal on 4 hr or daily charts.
Note
weekly chart Note
4 hr chart Note
At MAX it can touch 1.2 and not above that. if it break above 1.2 then Triangle pattern is not validatedDisclaimer
The information and publications are not meant to be, and do not constitute, financial, investment, trading, or other types of advice or recommendations supplied or endorsed by TradingView. Read more in the Terms of Use.
Disclaimer
The information and publications are not meant to be, and do not constitute, financial, investment, trading, or other types of advice or recommendations supplied or endorsed by TradingView. Read more in the Terms of Use.