It happened quickly but EUR/USD fell into oversold territory last Thursday in the aftermath of the Fed rate decision and the Core PCE report a day later. The pair fell all the way until the 1.1400 handle came into catch the lows in a move that had been very one-sided. But Friday served as reminder of why chasing developed breakouts can be so dangerous, as an NFP report with a massive revision to the headline print for the prior two months pulled the rug on the USD rally that had driven into Friday morning.
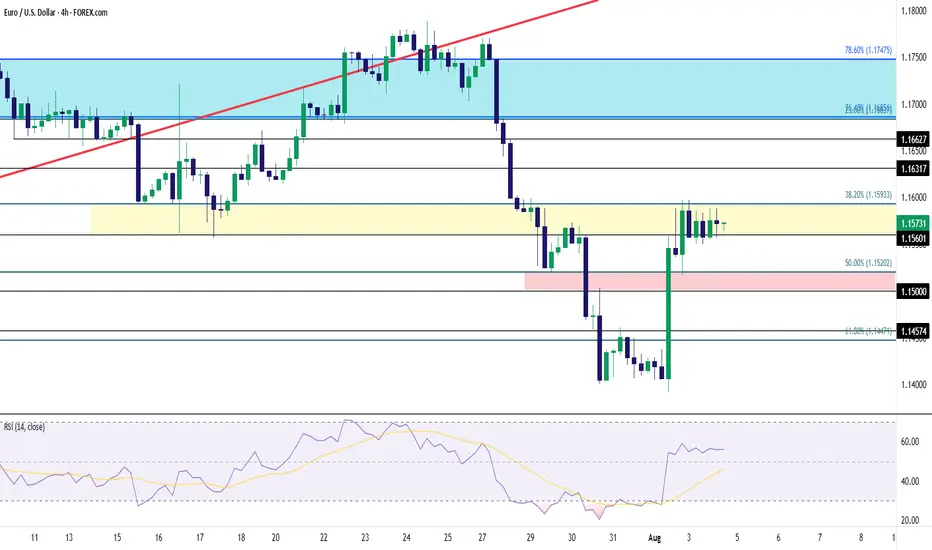
But now is where we find out the true trend in both EUR/USD and the USD. The last resistance level that I wrote of in the Thursday post at 1.1560 is currently in-play on EUR/USD, which along with the Fibonacci level at 1.1593 is helping to hold resistance so far today.
From the daily chart - this is a look of resistance at prior support - the same support that held the lows in mid-July before EUR/USD rallied up to a lower-high.
But from shorter-terms, even the four-hour chart, this can be argued as bullish given the continued show of strength above the 1.1500 handle. This sets up for a key support zone from 1.1500-1.1520, and if sellers can take that out, it'll look more attractive for that longer-term theme to play out.
But, until then, bulls have put in a strong showing with continued support at 1.1560 for today, and the door remains open for a test of deeper resistance at 1.1632, 1.1663 and then the longer-term Fibonacci level at 1.1686. - js
Related publications
Disclaimer
The information and publications are not meant to be, and do not constitute, financial, investment, trading, or other types of advice or recommendations supplied or endorsed by TradingView. Read more in the Terms of Use.
Related publications
Disclaimer
The information and publications are not meant to be, and do not constitute, financial, investment, trading, or other types of advice or recommendations supplied or endorsed by TradingView. Read more in the Terms of Use.