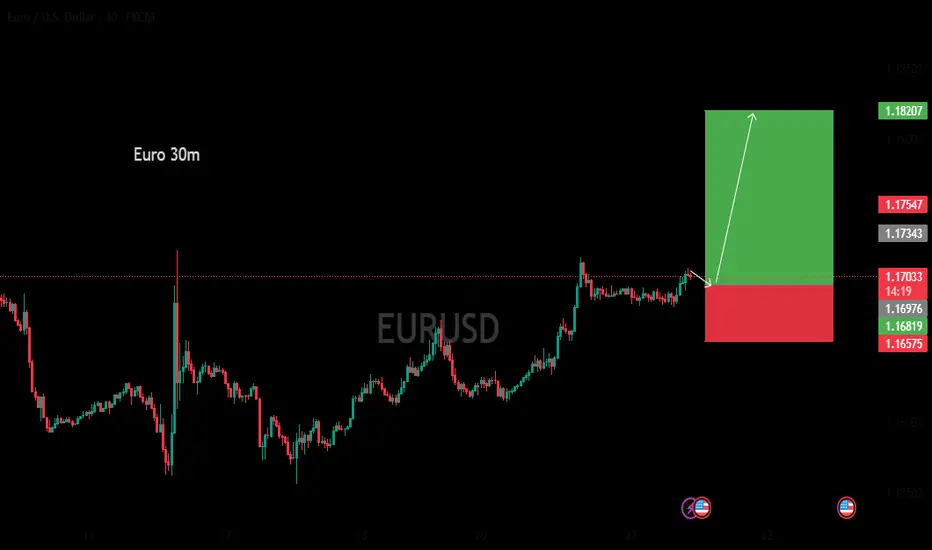
The chart has a black background with a line graph showing the price movement of EUR/USD over time. The graph features blue and pink lines indicating price fluctuations. A green and pink rectangle is overlaid on the right side of the chart, possibly highlighting a specific trading zone or strategy.
Trade active
market is in our favour and good runningDisclaimer
The information and publications are not meant to be, and do not constitute, financial, investment, trading, or other types of advice or recommendations supplied or endorsed by TradingView. Read more in the Terms of Use.
Disclaimer
The information and publications are not meant to be, and do not constitute, financial, investment, trading, or other types of advice or recommendations supplied or endorsed by TradingView. Read more in the Terms of Use.