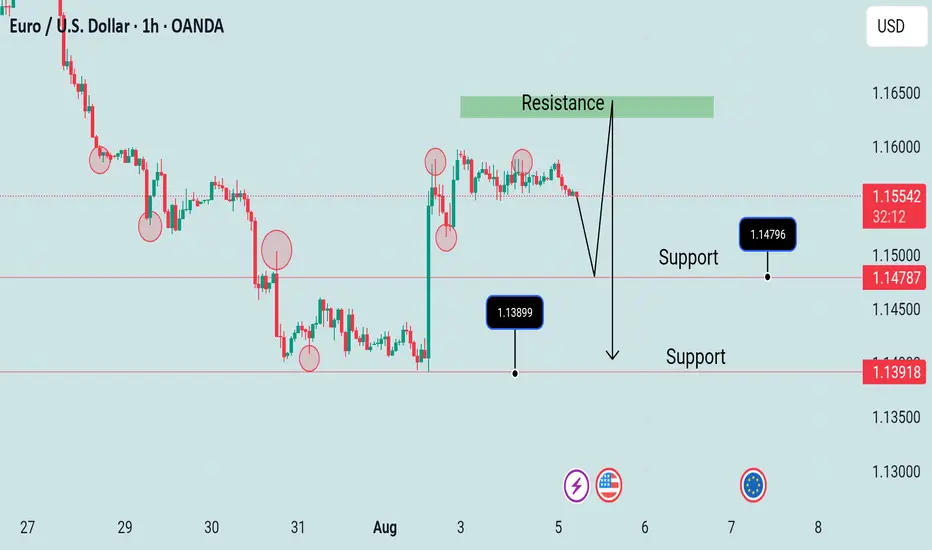
The daily chart for the EUR/USD pair shows the pair met buyers just ahead of a bullish 100 Simple Moving Average (SMA) currently at around 1.1370. A flat 20 SMA, in the meantime, provides resistance at around 1.1640, the level to overcome to turn bullish. Finally, technical indicators corrected oversold conditions, but lost their upward strength just below their midlines, suggesting buyers are still on the sidelines
EUR/USD has embarked on a consolidative phase after failing to retest the 1.1600 barrier in quite an apathetic start to the new trading week. The US Dollar, in the meantime, trades in a vacillating fashion as investors keep digesting Friday’s pronounced decline in the wake of the US jobs report.
EUR/USD has embarked on a consolidative phase after failing to retest the 1.1600 barrier in quite an apathetic start to the new trading week. The US Dollar, in the meantime, trades in a vacillating fashion as investors keep digesting Friday’s pronounced decline in the wake of the US jobs report.
Gold signal
t.me/ProTrader_9
My Channel Link
t.me/ProTrader_9
Check My Performance
t.me/ProTrader_9
My Channel Link
t.me/ProTrader_9
Check My Performance
Disclaimer
The information and publications are not meant to be, and do not constitute, financial, investment, trading, or other types of advice or recommendations supplied or endorsed by TradingView. Read more in the Terms of Use.