## 1 Hour (Intraday)
![1H chart zoom-in: consolidation between 1.13717 and 1.14500, pending buy at 1.1300, sell at 1.1600]
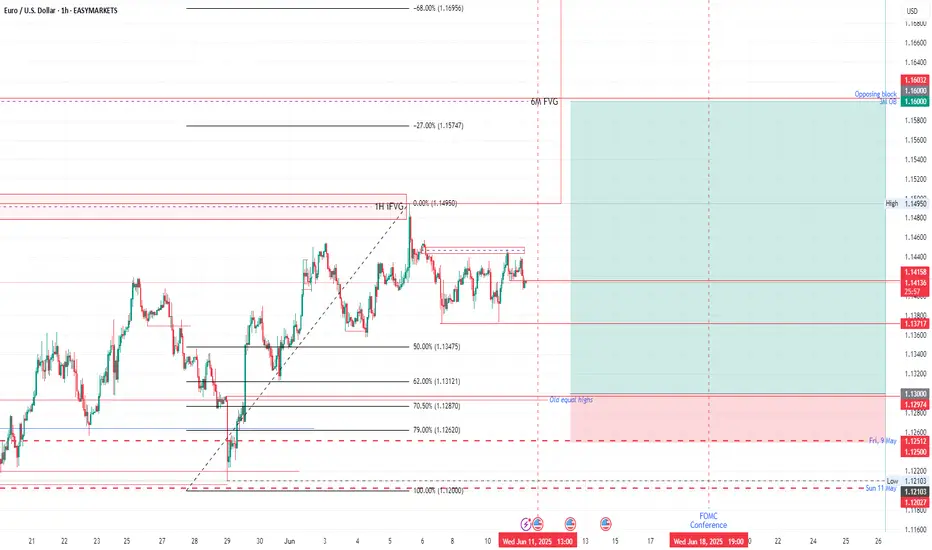
1. **Order-block / Fair-Value Gap**
* The small 1H consolidation you’ve boxed (roughly 1.1420–1.1450) is a late-hour fair-value gap (FVG) that often resolves with a quick run to its edge.
* A drop into the lower end (1.137–1.138) gives you liquidity for your long and aligns with the 1D 50 % retrace (1.13475).
2. **Pending Entries**
* **Buy-limit @ 1.1300**: Still unfilled. If price dips there, it converges the 1D 62 %–70.5 % zones (1.1312–1.1287) plus the old daily high → high-probability long.
* **Sell-limit @ 1.1600**: Above today’s high, overlapping the 6 M FVG at 1.1575 and the 3 M opposing block.
3. **Probability & Timeline**
* **To 1.1300**: \~30 % shot over the next 24–48 h as banks chase stops under 1.135.
* **To 1.1600**: \~25 % chance intraday if FOMC jitters push USD weaker post-June 18.
---
## 1 Month (Position)
![1M chart: 0.9535→1.2350 fib expansion, 1.13 base, FVG at 1.157, opp block at 1.275]
1. **Longer-term Fib & Time-zones**
* The full trough-to-peak fib (0 %→100 %) defines the 127 % extension at \~1.310, 227 % at \~1.214, 327 % at \~1.246.
* Your current clip sits just above the 127 % (1.310) retracement zone on a mini scale; the next *real* hurdle is the 227 % zone near 1.214/1.234 (old highs).
2. **Macro-Blocks**
* **3-month OB @1.1600**, **6-month FVG @1.1575**: your first “stop‐runs” on the way to the big opposing block at 1.2750 (500 %).
* Seasonal tailwinds tend to kick in around July–August as EU carry trades re-enter.
3. **Timeline & Odds**
* **Lift into 1.1575–1.1600**: \~60 % chance by late June → early July.
* **Extension toward 1.214–1.234** (long-term target): \~30 % chance by Q4 2025, assuming US yields peak and EUR carry resumes.
---
### Live-Data Check (Today ≈ 1.1415)
* **Above 1.1375** (daily 50 %) → bullish tilt until proven otherwise.
* **Below 1.1450** (1H FVG top) → still in consolidation zone; gives you a low-risk long if you see a wick down to 1.137–1.138.
* **No invalidation**: you’ve got room to run both your buy and sell limits without being stopped out today.
---
## Overall Probability & Path
| Leg | Zone | Prob. | Target Window |
| -------------- | --------------------------- | ----- | -------------- |
| Intraday sweep | 1.137→1.145 consolidation | 70 %↑ | next 1–2 days |
| Buy-zone test | 1.1300 (62–70 % daily fib) | 30 % | next 24–48 h |
| Swing rally | 1.1575–1.1600 (6 M FVG/OB) | 55 % | June 18–July 5 |
| Position drive | 1.214–1.234 (227–327 % fib) | 30 % | Q3–Q4 2025 |
1. **Catalysts**:
* **June 18 FOMC** (watch the red line) will likely ignite the swing leg.
* **July seasonal flows** (month-end rebalancing) give the first bump into your fair-value blocks.
2. **Risk management**:
* Keep your stops below 1.1340 for intraday longs, or below 1.1250 for the monthly swing.
* Scale out 50 % at 1.1575, trail the rest into the big opposing block.
---
— S.Atrial
![1H chart zoom-in: consolidation between 1.13717 and 1.14500, pending buy at 1.1300, sell at 1.1600]
1. **Order-block / Fair-Value Gap**
* The small 1H consolidation you’ve boxed (roughly 1.1420–1.1450) is a late-hour fair-value gap (FVG) that often resolves with a quick run to its edge.
* A drop into the lower end (1.137–1.138) gives you liquidity for your long and aligns with the 1D 50 % retrace (1.13475).
2. **Pending Entries**
* **Buy-limit @ 1.1300**: Still unfilled. If price dips there, it converges the 1D 62 %–70.5 % zones (1.1312–1.1287) plus the old daily high → high-probability long.
* **Sell-limit @ 1.1600**: Above today’s high, overlapping the 6 M FVG at 1.1575 and the 3 M opposing block.
3. **Probability & Timeline**
* **To 1.1300**: \~30 % shot over the next 24–48 h as banks chase stops under 1.135.
* **To 1.1600**: \~25 % chance intraday if FOMC jitters push USD weaker post-June 18.
---
## 1 Month (Position)
![1M chart: 0.9535→1.2350 fib expansion, 1.13 base, FVG at 1.157, opp block at 1.275]
1. **Longer-term Fib & Time-zones**
* The full trough-to-peak fib (0 %→100 %) defines the 127 % extension at \~1.310, 227 % at \~1.214, 327 % at \~1.246.
* Your current clip sits just above the 127 % (1.310) retracement zone on a mini scale; the next *real* hurdle is the 227 % zone near 1.214/1.234 (old highs).
2. **Macro-Blocks**
* **3-month OB @1.1600**, **6-month FVG @1.1575**: your first “stop‐runs” on the way to the big opposing block at 1.2750 (500 %).
* Seasonal tailwinds tend to kick in around July–August as EU carry trades re-enter.
3. **Timeline & Odds**
* **Lift into 1.1575–1.1600**: \~60 % chance by late June → early July.
* **Extension toward 1.214–1.234** (long-term target): \~30 % chance by Q4 2025, assuming US yields peak and EUR carry resumes.
---
### Live-Data Check (Today ≈ 1.1415)
* **Above 1.1375** (daily 50 %) → bullish tilt until proven otherwise.
* **Below 1.1450** (1H FVG top) → still in consolidation zone; gives you a low-risk long if you see a wick down to 1.137–1.138.
* **No invalidation**: you’ve got room to run both your buy and sell limits without being stopped out today.
---
## Overall Probability & Path
| Leg | Zone | Prob. | Target Window |
| -------------- | --------------------------- | ----- | -------------- |
| Intraday sweep | 1.137→1.145 consolidation | 70 %↑ | next 1–2 days |
| Buy-zone test | 1.1300 (62–70 % daily fib) | 30 % | next 24–48 h |
| Swing rally | 1.1575–1.1600 (6 M FVG/OB) | 55 % | June 18–July 5 |
| Position drive | 1.214–1.234 (227–327 % fib) | 30 % | Q3–Q4 2025 |
1. **Catalysts**:
* **June 18 FOMC** (watch the red line) will likely ignite the swing leg.
* **July seasonal flows** (month-end rebalancing) give the first bump into your fair-value blocks.
2. **Risk management**:
* Keep your stops below 1.1340 for intraday longs, or below 1.1250 for the monthly swing.
* Scale out 50 % at 1.1575, trail the rest into the big opposing block.
---
— S.Atrial
Disclaimer
The information and publications are not meant to be, and do not constitute, financial, investment, trading, or other types of advice or recommendations supplied or endorsed by TradingView. Read more in the Terms of Use.
Disclaimer
The information and publications are not meant to be, and do not constitute, financial, investment, trading, or other types of advice or recommendations supplied or endorsed by TradingView. Read more in the Terms of Use.