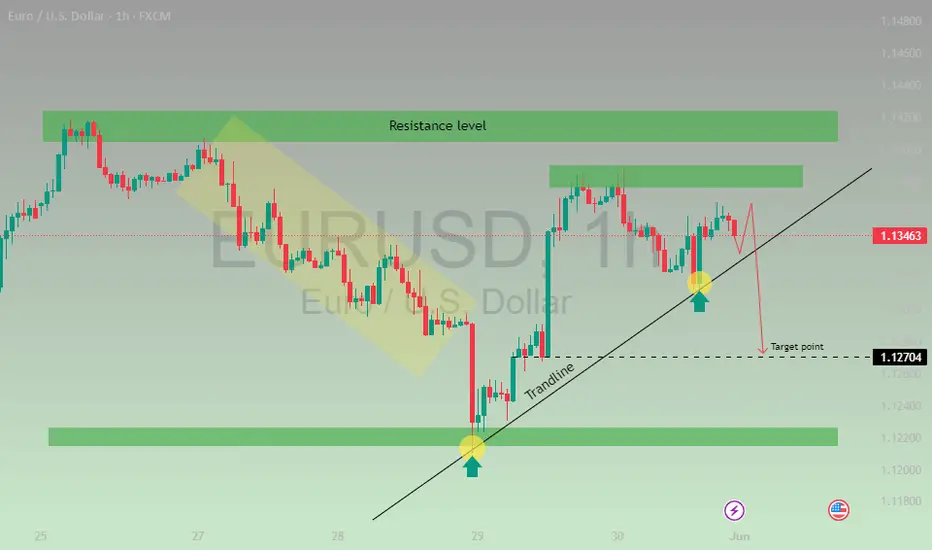
This chart shows the EUR/USD price movement and a possible setup for a sell trade.
The black line is a trendline showing that the price was moving upward.
The green zones are support and resistance levels where the price often changes direction.
The price has touched the trendline several times and moved up, but now it is near a resistance level.
The chart suggests that the price might go down from this resistance level.
The expected target for the drop is around the 1.12704 level.
In summary, the chart is predicting a possible downward move after reaching the resistance area.
Disclaimer
The information and publications are not meant to be, and do not constitute, financial, investment, trading, or other types of advice or recommendations supplied or endorsed by TradingView. Read more in the Terms of Use.
Disclaimer
The information and publications are not meant to be, and do not constitute, financial, investment, trading, or other types of advice or recommendations supplied or endorsed by TradingView. Read more in the Terms of Use.