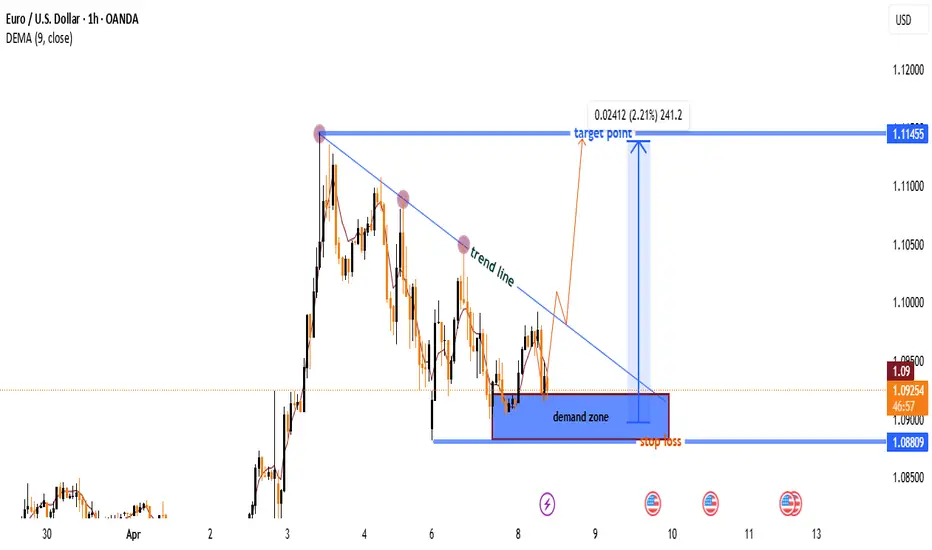
EUR/USD 1H Chart Analysis
🔵 Trend Line:
* Price was respecting a falling trend line
* Lower highs marked with 🔴 red dots showing bearish pressure
🟦 Demand Zone (Support Area):
* Price is currently hovering around a demand zone
* Marked by a blue box — this is where buyers are stepping in
* Think of this as a "bounce zone"
📍Marked with 🟦 blue dots as key bounce points
🚀 Potential Bullish Breakout: • If price breaks the trend line — get ready for lift-off
* Entry idea: ✅ Buy near the bottom of the blue zone
* Target: 🎯 1.11455
* Profit potential: +241 pips (2.21%)
* Move marked with 🟧 upward arrow path
❌ Stop Loss: • Just below the demand zone at 1.08809
* Marked with a ⚠️ stop sign to avoid large losses
📉 DEMA (9): • Yellow moving average line — shows recent momentum
* Right now, price is slightly below it, but a break above can support bullish case
Summary:
Buy Setup
✅ Entry: Around 1.09000 (🟦 demand zone)
🎯 Target: 1.11455
⚠️ Stop Loss: 1.08809
📈 Risk:Reward — Great!
join my tellegram channel
t.me/JaMesGoldFiGhteR786
join my refferal broker
xmglobal.com/referral?token=S4yGyqPUmU9uAANtb_YUoA
t.me/JaMesGoldFiGhteR786
join my refferal broker
xmglobal.com/referral?token=S4yGyqPUmU9uAANtb_YUoA
Related publications
Disclaimer
The information and publications are not meant to be, and do not constitute, financial, investment, trading, or other types of advice or recommendations supplied or endorsed by TradingView. Read more in the Terms of Use.