EUR/USD (Euro / U.S. Dollar) 2-hour chart analysis, here's the breakdown:
---
📈 Chart Setup Observations:
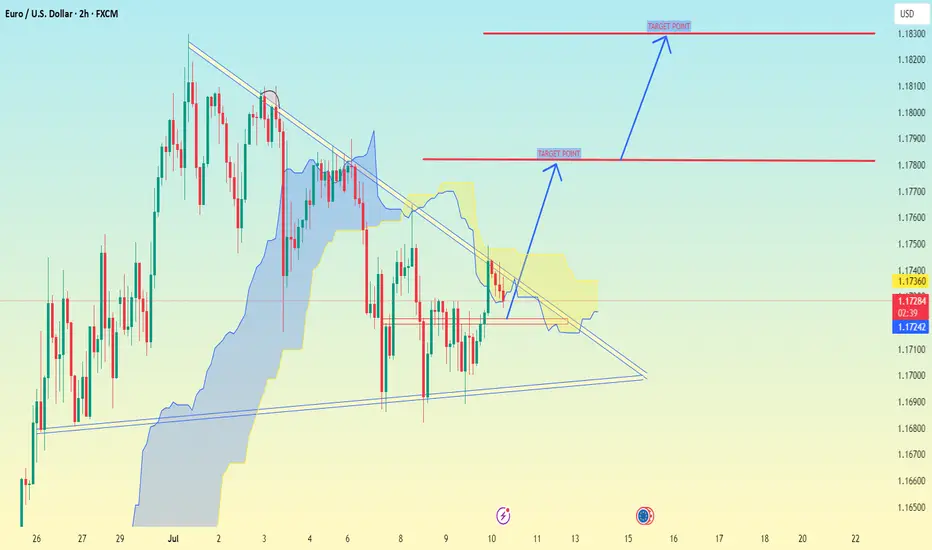
The pair is showing a bullish breakout from a descending triangle or falling wedge pattern.
Price is above the Ichimoku Cloud, suggesting a potential shift to bullish momentum.
There are two clearly marked target points on your chart.
---
🎯 Target Levels:
1. Target Point 1 (TP1): Approximately 1.78000
2. Target Point 2 (TP2): Approximately 1.18300
---
🔰 Support Zone / Potential Stop-Loss:
Around 1.17200, where recent consolidation and trendline support can be seen.
---
✅ Summary:
If the bullish breakout holds and momentum continues, the pair could reach:
TP1: ~1.78000 (short-term target)
TP2: ~1.18300 (medium-term target)
---
📈 Chart Setup Observations:
The pair is showing a bullish breakout from a descending triangle or falling wedge pattern.
Price is above the Ichimoku Cloud, suggesting a potential shift to bullish momentum.
There are two clearly marked target points on your chart.
---
🎯 Target Levels:
1. Target Point 1 (TP1): Approximately 1.78000
2. Target Point 2 (TP2): Approximately 1.18300
---
🔰 Support Zone / Potential Stop-Loss:
Around 1.17200, where recent consolidation and trendline support can be seen.
---
✅ Summary:
If the bullish breakout holds and momentum continues, the pair could reach:
TP1: ~1.78000 (short-term target)
TP2: ~1.18300 (medium-term target)
Trade active
active t.me/RSI_Trading_Point4
Forex, gold and crypto signal's with detailed analysis & get consistent results..
t.me/Gold_Analysis_Experiment
Gold signal's with proper TP & SL for high profits opportunities..
Forex, gold and crypto signal's with detailed analysis & get consistent results..
t.me/Gold_Analysis_Experiment
Gold signal's with proper TP & SL for high profits opportunities..
Related publications
Disclaimer
The information and publications are not meant to be, and do not constitute, financial, investment, trading, or other types of advice or recommendations supplied or endorsed by TradingView. Read more in the Terms of Use.
t.me/RSI_Trading_Point4
Forex, gold and crypto signal's with detailed analysis & get consistent results..
t.me/Gold_Analysis_Experiment
Gold signal's with proper TP & SL for high profits opportunities..
Forex, gold and crypto signal's with detailed analysis & get consistent results..
t.me/Gold_Analysis_Experiment
Gold signal's with proper TP & SL for high profits opportunities..
Related publications
Disclaimer
The information and publications are not meant to be, and do not constitute, financial, investment, trading, or other types of advice or recommendations supplied or endorsed by TradingView. Read more in the Terms of Use.