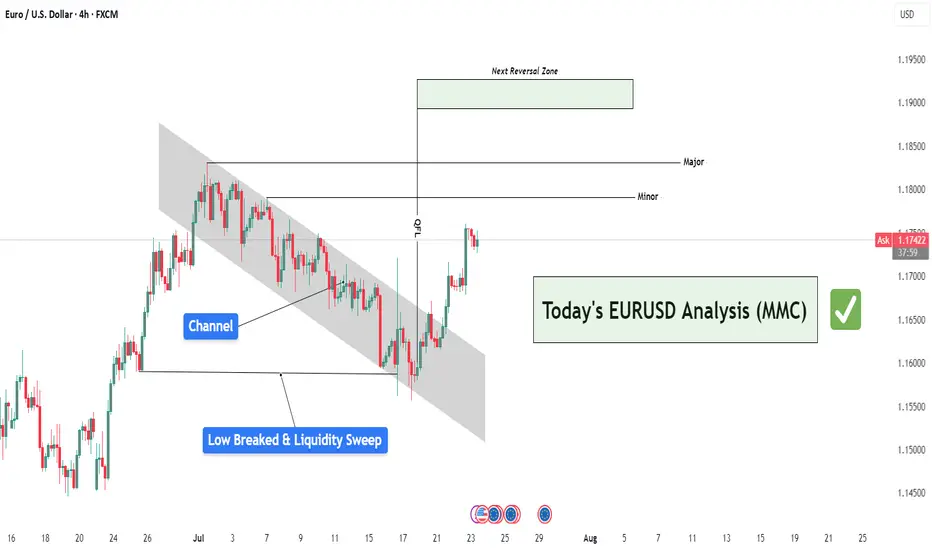
🧠 Institutional Context & Big Picture
EURUSD has been in a tightly controlled descending channel for several weeks—a classic sign of a market being engineered for liquidity collection. Rather than a naturally trending bearish market, this price action reflects stealth accumulation and market maker manipulation.
The channel structure was used to:
Establish a visible bearish trend (to trap sellers)
Trigger emotional bias for continued shorting
Build up stop orders below swing lows
This phase was about building energy, not continuation.
🔍 Detailed Breakdown of the Chart Elements
📌 1. Descending Channel – Controlled Manipulation
The pair moved within a well-defined bearish channel for multiple weeks.
Each touch respected the top and bottom perfectly—not random, but institutional structure.
It fostered retail confidence in the downtrend while market makers prepared for a reversal.
💥 2. Liquidity Sweep & Trap (Low Breaked & Liquidity Grabbed)
Price spiked below the previous low, clearly sweeping liquidity on July 21.
This is the "engineered breakdown", meant to trigger breakout sellers and stop out early longs.
Immediately after the sweep, the price violently reversed—clear evidence of a liquidity trap.
This is classic MMC logic: induce, trap, reverse.
🟩 3. QFL Base Formed – Bullish Engine Ignited
At the point of reversal, the chart shows the formation of a QFL (Qualified Liquidation Failure) zone.
This QFL base is the core of smart money accumulation—price broke below a base, then quickly reclaimed it.
It's not just support—it’s the true origin of the reversal and an optimal entry point.
📈 4. Breakout from the Channel – Structure Shift Confirmed
Price broke out of the descending channel with strong momentum, confirming:
Structure shift from lower lows → higher highs
Momentum shift in favor of bulls
Entry confirmation for MMC-based long setups
This breakout invalidates the bearish trend and signals a fresh leg up, likely toward unmitigated supply zones.
🟨 5. Current Price Action – Healthy Bullish Consolidation
After the breakout, price is consolidating just above the broken channel, forming a mini-flag or base.
This indicates:
Smart money is accumulating more
No significant selling pressure
Likely continuation toward next supply
🎯 6. Next Targets – Reversal Zones
Minor Resistance: ~1.1800
Major Resistance: ~1.1850 – 1.1880
Next Reversal Zone: 1.1900–1.1950
This zone is highlighted as a potential sell-off area where institutions may offload positions or create new traps.
Watch for signs of exhaustion or redistribution here.
📌 Trade Plan Based on MMC Structure
✅ Bullish Scenario (Currently Active)
Entry Area: Ideally at QFL base or breakout retest (~1.1700–1.1720 zone)
Confirmation: Bullish price action (engulfing, flag break, or liquidity wick)
Targets:
🎯 TP1: 1.1800
🎯 TP2: 1.1850
🎯 TP3: 1.1950 (Reversal Supply Zone)
❌ Invalidation:
A break below the QFL base (~1.1670) with bearish volume would invalidate the bullish MMC structure.
🧠 Smart Money Insight & Logic Recap
This entire move reflects a classic Market Maker Strategy:
Build a trend (descending channel) to shape trader bias
Trigger liquidity events (false breakdown)
Accumulate at the lows via QFL logic
Shift structure (channel breakout)
Target unfilled institutional supply (1.1850–1.1950)
This isn’t random—it’s engineered movement. Your job as a trader is to identify footprints, not follow the crowd.
For Daily Trade Setups and Forecast: 📈 t.me/xauusdoptimizer
Premium Signals Fr33: 💯 t.me/xauusdoptimizer
🥰🥳🤩
Premium Signals Fr33: 💯 t.me/xauusdoptimizer
🥰🥳🤩
Related publications
Disclaimer
The information and publications are not meant to be, and do not constitute, financial, investment, trading, or other types of advice or recommendations supplied or endorsed by TradingView. Read more in the Terms of Use.