H4
H1
What to do now?
Good Luck to all traders!!!
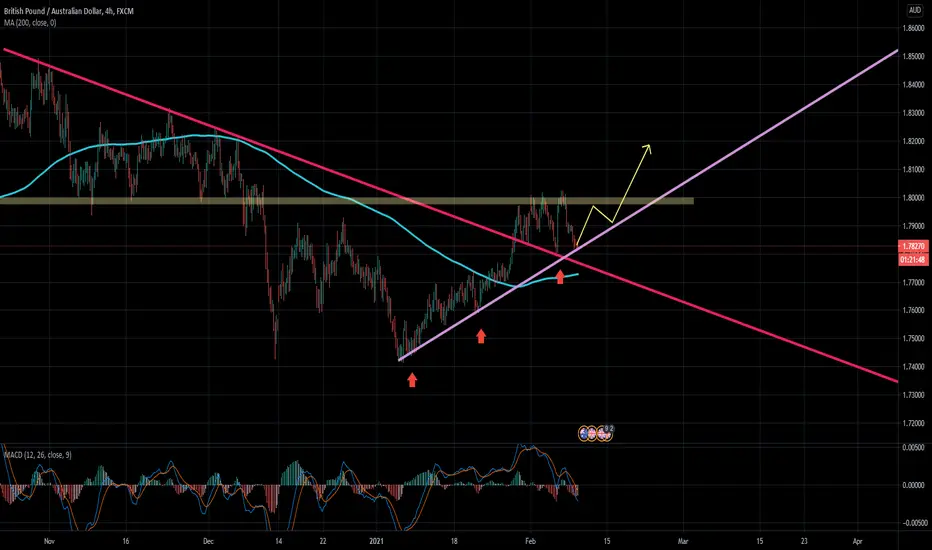
- Currently testing upward trendline which is the purple trendline
- Break through the previous downward trendline which is the Pink trendline
- A support at the bottom of Fibo 0.382 level
- The candlestick is above the 200SMA trendline that's mean trend might be bullish
- And 200 SMA can be a support level due to the historical pattern formed
- MACD begins exhaustion weakness shows by the red histogram is changes to the pink histogram and reducing the bearish momentum
H1
- The current movement in the upward channel
- MACD line and Signal line made across under the 0 that might have a trend changes in the future
- histogram of MACD was standing above the 0 and the histogram are staying dark green that's mean the bullish momentum is still strong
What to do now?
- Long the market immediately or
- Waiting for confirmation due to currently is retesting the support zone
- Please do your own proper risk management
Good Luck to all traders!!!
Disclaimer
The information and publications are not meant to be, and do not constitute, financial, investment, trading, or other types of advice or recommendations supplied or endorsed by TradingView. Read more in the Terms of Use.
Disclaimer
The information and publications are not meant to be, and do not constitute, financial, investment, trading, or other types of advice or recommendations supplied or endorsed by TradingView. Read more in the Terms of Use.