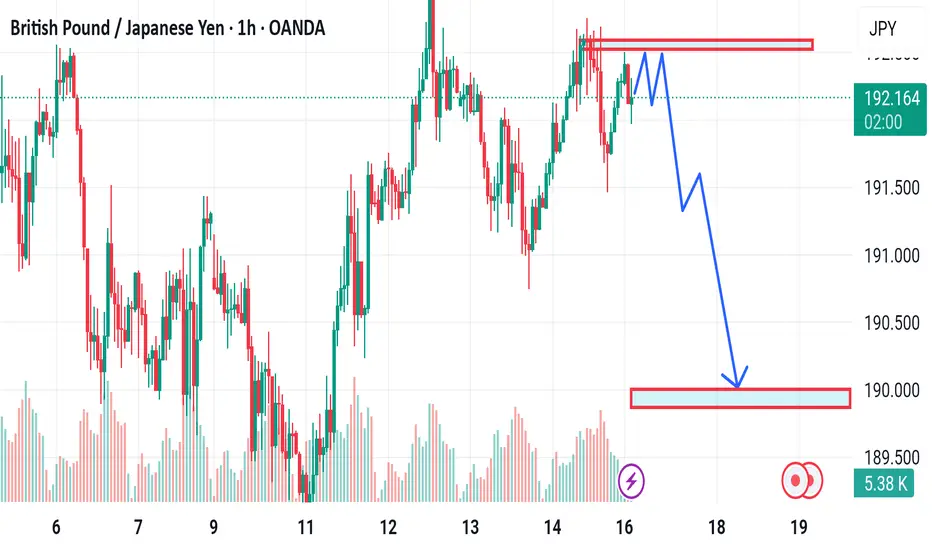
GBP/JPY Forecast Based on the Chart Analysis
Market Outlook
Current Price: 192.208
Resistance Zone: 192.500 - 193.000
Support Zone: 190.000
Technical Analysis
The chart suggests that GBP/JPY is approaching a resistance level near 192.500 - 193.000.
A rejection from this zone could push the price lower towards 190.000, as indicated by the blue arrow.
The bearish scenario is supported by price action, where multiple rejections at resistance suggest a potential downside move.
Forecast Scenarios
1. Bearish Case (More Likely Based on Chart)
If price fails to break above 192.500 - 193.000, it could drop towards 190.000.
Confirmation of this move would be a clear rejection candle or increased selling pressure.
2. Bullish Case (Less Likely Unless Breakout Occurs)
If GBP/JPY breaks and closes above 193.000, further upside movement toward 194.000 could be expected.
Trade Plan
Sell Entry: Near 192.500 - 193.000 (if rejection occurs).
Target: 190.000 (first support level).
Stop-Loss: Above 193.200 (if price breaks out).
Disclaimer
The information and publications are not meant to be, and do not constitute, financial, investment, trading, or other types of advice or recommendations supplied or endorsed by TradingView. Read more in the Terms of Use.
Disclaimer
The information and publications are not meant to be, and do not constitute, financial, investment, trading, or other types of advice or recommendations supplied or endorsed by TradingView. Read more in the Terms of Use.
