Market Analysis: GBP/USD Dips Below Support
GBP/USD started a fresh decline below the 1.3620 zone.
Important Takeaways for GBP/USD Analysis Today
- The British Pound started another decline from the 1.3620 resistance zone.
- There was a break below a connecting bullish trend line with support at 1.3460 on the hourly chart of GBP/USD at FXOpen.
GBP/USD Technical Analysis

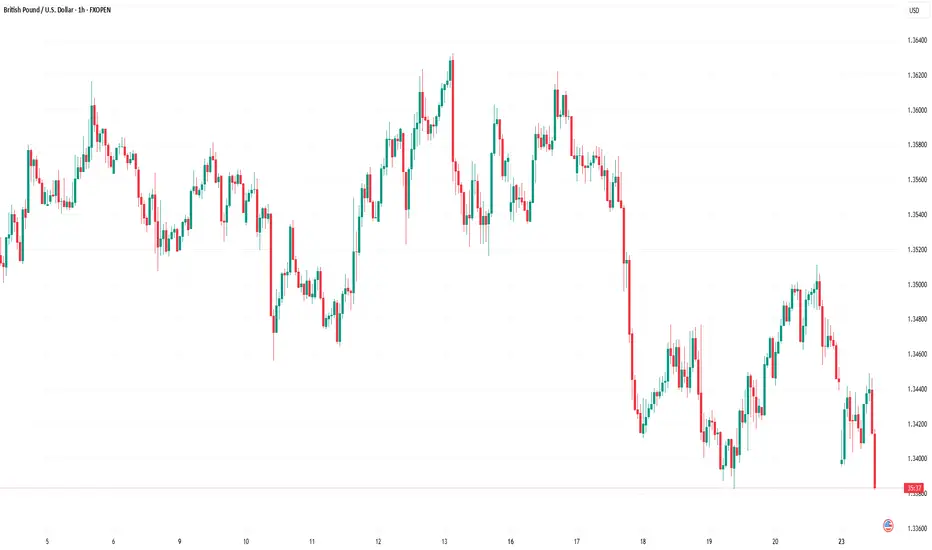
On the hourly chart of GBP/USD at FXOpen, the pair struggled to continue higher above the 1.3620 resistance zone. The British Pound started a fresh decline and traded below the 1.3550 support zone against the US Dollar, as discussed in the previous analysis.
The pair even traded below 1.3500 and the 50-hour simple moving average. Finally, the bulls appeared near the 1.3380 level. There was a recovery wave above the 1.3450 level and the 23.6% Fib retracement level of the downward move from the 1.3622 swing high to the 1.3382 low.
However, the bears were active near the 1.3500 zone and the 50% Fib retracement level. As a result, there was a fresh bearish reaction below a connecting bullish trend line with support at 1.3460.
Initial support on the GBP/USD chart sits at 1.3380. The next major support is at 1.3350, below which there is a risk of another sharp decline. In the stated case, the pair could drop toward 1.3200.
Immediate resistance on the upside is near 1.3440. The first major resistance is near the 1.3500 zone. The main hurdle sits at 1.3530. A close above the 1.3530 resistance might spark a steady upward move. The next major resistance is near the 1.3565 zone. Any more gains could lead the pair toward the 1.3620 resistance in the near term.
This article represents the opinion of the Companies operating under the FXOpen brand only. It is not to be construed as an offer, solicitation, or recommendation with respect to products and services provided by the Companies operating under the FXOpen brand, nor is it to be considered financial advice.
GBP/USD started a fresh decline below the 1.3620 zone.
Important Takeaways for GBP/USD Analysis Today
- The British Pound started another decline from the 1.3620 resistance zone.
- There was a break below a connecting bullish trend line with support at 1.3460 on the hourly chart of GBP/USD at FXOpen.
GBP/USD Technical Analysis
On the hourly chart of GBP/USD at FXOpen, the pair struggled to continue higher above the 1.3620 resistance zone. The British Pound started a fresh decline and traded below the 1.3550 support zone against the US Dollar, as discussed in the previous analysis.
The pair even traded below 1.3500 and the 50-hour simple moving average. Finally, the bulls appeared near the 1.3380 level. There was a recovery wave above the 1.3450 level and the 23.6% Fib retracement level of the downward move from the 1.3622 swing high to the 1.3382 low.
However, the bears were active near the 1.3500 zone and the 50% Fib retracement level. As a result, there was a fresh bearish reaction below a connecting bullish trend line with support at 1.3460.
Initial support on the GBP/USD chart sits at 1.3380. The next major support is at 1.3350, below which there is a risk of another sharp decline. In the stated case, the pair could drop toward 1.3200.
Immediate resistance on the upside is near 1.3440. The first major resistance is near the 1.3500 zone. The main hurdle sits at 1.3530. A close above the 1.3530 resistance might spark a steady upward move. The next major resistance is near the 1.3565 zone. Any more gains could lead the pair toward the 1.3620 resistance in the near term.
This article represents the opinion of the Companies operating under the FXOpen brand only. It is not to be construed as an offer, solicitation, or recommendation with respect to products and services provided by the Companies operating under the FXOpen brand, nor is it to be considered financial advice.
Disclaimer
The information and publications are not meant to be, and do not constitute, financial, investment, trading, or other types of advice or recommendations supplied or endorsed by TradingView. Read more in the Terms of Use.
Disclaimer
The information and publications are not meant to be, and do not constitute, financial, investment, trading, or other types of advice or recommendations supplied or endorsed by TradingView. Read more in the Terms of Use.