This chart provides a trading signal for GBP/USD (British Pound / US Dollar) on the 45-minute timeframe, as of May 1, 2025. Here are the key technical details:
Current Market Data:
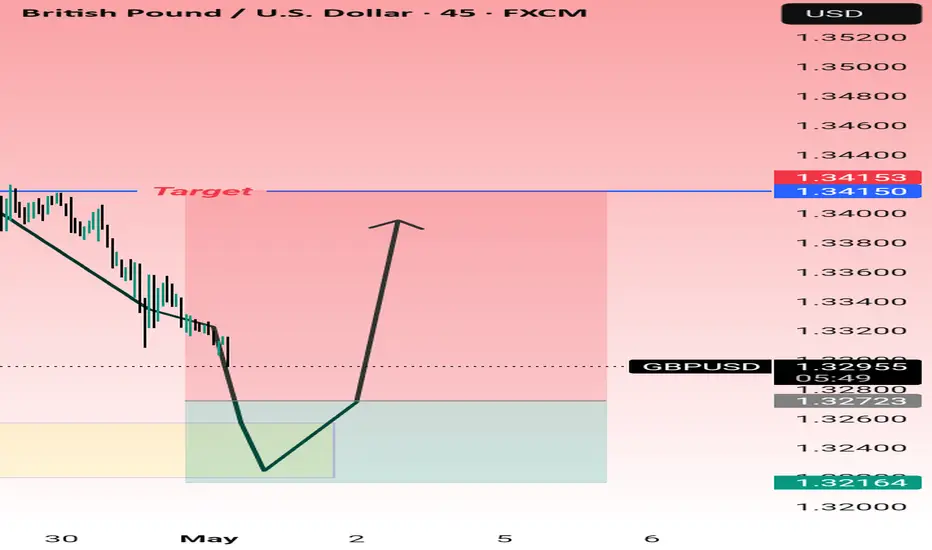
Price: 1.32974
Change: -0.00278 (-0.21%)
Signal Summary:
Entry Zone: Price is approaching a demand/support zone (green highlighted area) between 1.32723 and 1.32164.
Expected Movement:
Bullish reversal is anticipated from the support zone.
The chart suggests a long trade setup with a sharp upward move.
Target Level: Around 1.34150 (horizontal blue resistance line labeled as “Target”).
Risk Management:
Support (possible stop-loss area): Near 1.32164.
Resistance (profit-taking zone): Near 1.34150–1.34153.
Trade Idea (Long):
Buy: Near 1.32700–1.32164 (green zone)
Take Profit (TP): ~1.34150
Stop Loss (SL): Below 1.32164
This signal implies a bullish bounce setup targeting a 100+ pip move with a favorable risk-to-reward ratio.
Would you like this setup converted into a text-based trading plan or alert format?
Current Market Data:
Price: 1.32974
Change: -0.00278 (-0.21%)
Signal Summary:
Entry Zone: Price is approaching a demand/support zone (green highlighted area) between 1.32723 and 1.32164.
Expected Movement:
Bullish reversal is anticipated from the support zone.
The chart suggests a long trade setup with a sharp upward move.
Target Level: Around 1.34150 (horizontal blue resistance line labeled as “Target”).
Risk Management:
Support (possible stop-loss area): Near 1.32164.
Resistance (profit-taking zone): Near 1.34150–1.34153.
Trade Idea (Long):
Buy: Near 1.32700–1.32164 (green zone)
Take Profit (TP): ~1.34150
Stop Loss (SL): Below 1.32164
This signal implies a bullish bounce setup targeting a 100+ pip move with a favorable risk-to-reward ratio.
Would you like this setup converted into a text-based trading plan or alert format?
Disclaimer
The information and publications are not meant to be, and do not constitute, financial, investment, trading, or other types of advice or recommendations supplied or endorsed by TradingView. Read more in the Terms of Use.
Disclaimer
The information and publications are not meant to be, and do not constitute, financial, investment, trading, or other types of advice or recommendations supplied or endorsed by TradingView. Read more in the Terms of Use.