🏦 GBPUSD Analysis – June 17, 2025 | 1H Chart
🔻 Market Structure Overview
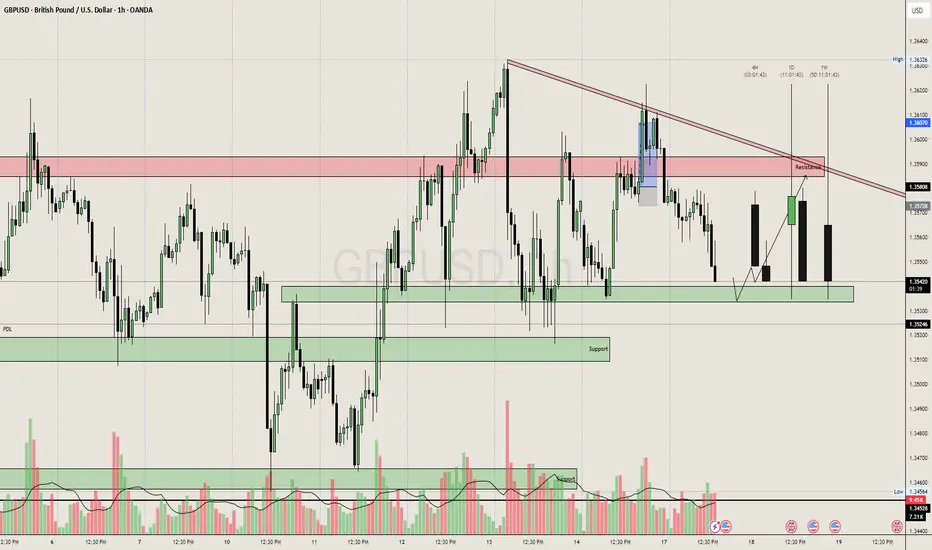
Currently ranging between 1.3524 support and 1.3607 resistance.
Price is inside a descending triangle – bearish structure.
Clean rejections from descending trendline; each retest brings in lower highs.
🔍 Key Zones
🔴 Resistance (1.3580–1.3610)
Multiple rejections + prior breaker block.
Last rally into this zone (highlighted in blue) was immediately sold off → liquidity grab.
Trendline confluence above it adds extra weight.
🟢 Support (1.3524–1.3544)
Price has bounced here 3 times → forming short-term demand.
However, each bounce is losing momentum – classic absorption sign.
🧠 Institutional Clues
Volume Spikes on down moves = sellers active at highs.
Up candles = low volume, weak buyer intent.
That wick fake-out at 1.3580 → clear stop hunt.
📉 Sell-Side Setup (Bias: Bearish)
Entry Concepts:
Sell on retest of broken structure near 1.3578–1.3590.
OR Breakdown play below 1.3524, wait for candle close & retest.
🎯 Targets:
TP1: 1.3500 psychological + low volume node
TP2: 1.3465 (marked previous low)
TP3: 1.3420–1.3400 (daily imbalance fill area)
🛑 Invalidation:
Break & hold above 1.3610, invalidates the triangle and flips to bullish breakout.
💡 Trade Idea Example:
Sell Limit @ 1.3580
SL: 1.3615
TP1: 1.3500
TP2: 1.3465
RR: ~1:3+
🔮 Final Thoughts:
GBPUSD is coiling inside a tightening structure; a breakdown is more likely due to bearish pressure, trendline resistance, and repeated absorption of buyers.
Watch DXY strength too — any bullish push on USD can trigger a clean flush.
🔻 Market Structure Overview
Currently ranging between 1.3524 support and 1.3607 resistance.
Price is inside a descending triangle – bearish structure.
Clean rejections from descending trendline; each retest brings in lower highs.
🔍 Key Zones
🔴 Resistance (1.3580–1.3610)
Multiple rejections + prior breaker block.
Last rally into this zone (highlighted in blue) was immediately sold off → liquidity grab.
Trendline confluence above it adds extra weight.
🟢 Support (1.3524–1.3544)
Price has bounced here 3 times → forming short-term demand.
However, each bounce is losing momentum – classic absorption sign.
🧠 Institutional Clues
Volume Spikes on down moves = sellers active at highs.
Up candles = low volume, weak buyer intent.
That wick fake-out at 1.3580 → clear stop hunt.
📉 Sell-Side Setup (Bias: Bearish)
Entry Concepts:
Sell on retest of broken structure near 1.3578–1.3590.
OR Breakdown play below 1.3524, wait for candle close & retest.
🎯 Targets:
TP1: 1.3500 psychological + low volume node
TP2: 1.3465 (marked previous low)
TP3: 1.3420–1.3400 (daily imbalance fill area)
🛑 Invalidation:
Break & hold above 1.3610, invalidates the triangle and flips to bullish breakout.
💡 Trade Idea Example:
Sell Limit @ 1.3580
SL: 1.3615
TP1: 1.3500
TP2: 1.3465
RR: ~1:3+
🔮 Final Thoughts:
GBPUSD is coiling inside a tightening structure; a breakdown is more likely due to bearish pressure, trendline resistance, and repeated absorption of buyers.
Watch DXY strength too — any bullish push on USD can trigger a clean flush.
Disclaimer
The information and publications are not meant to be, and do not constitute, financial, investment, trading, or other types of advice or recommendations supplied or endorsed by TradingView. Read more in the Terms of Use.
Disclaimer
The information and publications are not meant to be, and do not constitute, financial, investment, trading, or other types of advice or recommendations supplied or endorsed by TradingView. Read more in the Terms of Use.