May be consoldation price is falling .
1. Chart Patterns Observed:
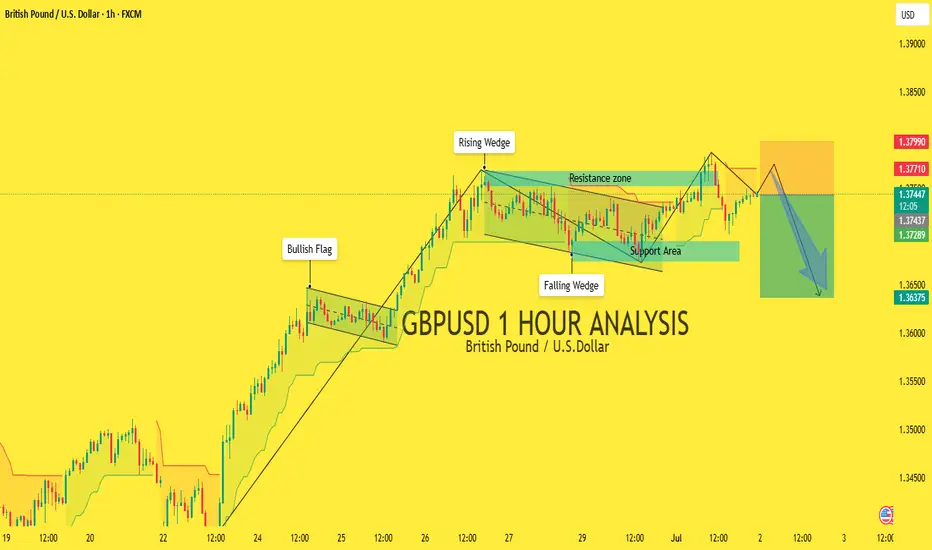
✅ Bullish Flag:
Occurred after a strong upward move (flagpole).
The breakout from the flag confirmed continuation to the upside.
✅ Rising Wedge:
Typically a bearish reversal pattern, especially after an extended uptrend.
Price broke down from the wedge, indicating bearish pressure.
✅ Falling Wedge:
Often a bullish reversal pattern.
Price respected the support area and broke upwards from the wedge.
2. Key Zones:
🔵 Resistance Zone (Around 1.37710 - 1.37990):
Price has reacted from this area multiple times.
Sellers are likely to be active here.
🟢 Support Area (Around 1.36375 - 1.37289):
Price found support in this zone previously.
Buyers could defend this level again.
3. Price Action & Projection:
After the falling wedge breakout, price moved up into the resistance zone.
A bearish correction is anticipated, as shown by the projected blue arrows.
The expectation is a lower high forming near the resistance zone, followed by a downward move towards the support area.
4. Possible Scenarios:
Bearish Scenario (Preferred Based on Chart):
✔ Price rejects the resistance zone (1.37710 - 1.37990).
✔ Confirmation via bearish candlestick patterns.
✔ Potential short trade targeting the 1.36375 support zone.
Bullish Scenario (Invalidation):
✔ If price breaks and sustains above 1.37990 with strong bullish momentum.
✔ Could trigger further upside towards 1.38500+ levels.
1. Chart Patterns Observed:
✅ Bullish Flag:
Occurred after a strong upward move (flagpole).
The breakout from the flag confirmed continuation to the upside.
✅ Rising Wedge:
Typically a bearish reversal pattern, especially after an extended uptrend.
Price broke down from the wedge, indicating bearish pressure.
✅ Falling Wedge:
Often a bullish reversal pattern.
Price respected the support area and broke upwards from the wedge.
2. Key Zones:
🔵 Resistance Zone (Around 1.37710 - 1.37990):
Price has reacted from this area multiple times.
Sellers are likely to be active here.
🟢 Support Area (Around 1.36375 - 1.37289):
Price found support in this zone previously.
Buyers could defend this level again.
3. Price Action & Projection:
After the falling wedge breakout, price moved up into the resistance zone.
A bearish correction is anticipated, as shown by the projected blue arrows.
The expectation is a lower high forming near the resistance zone, followed by a downward move towards the support area.
4. Possible Scenarios:
Bearish Scenario (Preferred Based on Chart):
✔ Price rejects the resistance zone (1.37710 - 1.37990).
✔ Confirmation via bearish candlestick patterns.
✔ Potential short trade targeting the 1.36375 support zone.
Bullish Scenario (Invalidation):
✔ If price breaks and sustains above 1.37990 with strong bullish momentum.
✔ Could trigger further upside towards 1.38500+ levels.
Trade active
Congratullation our half target achived market is in our favour . around 50+PIPS running profit.Trade closed: target reached
Congartullation guys my all target has been successfully reached at our target around 200+PIPS in profit Best Analysis xauusd single
t.me/+SAB5y_Kpm8RjYjlk
VIP PREMIMUM ANALYSIS ROOM SIGNALS
t.me/+SAB5y_Kpm8RjYjlk
t.me/+SAB5y_Kpm8RjYjlk
VIP PREMIMUM ANALYSIS ROOM SIGNALS
t.me/+SAB5y_Kpm8RjYjlk
Disclaimer
The information and publications are not meant to be, and do not constitute, financial, investment, trading, or other types of advice or recommendations supplied or endorsed by TradingView. Read more in the Terms of Use.
Best Analysis xauusd single
t.me/+SAB5y_Kpm8RjYjlk
VIP PREMIMUM ANALYSIS ROOM SIGNALS
t.me/+SAB5y_Kpm8RjYjlk
t.me/+SAB5y_Kpm8RjYjlk
VIP PREMIMUM ANALYSIS ROOM SIGNALS
t.me/+SAB5y_Kpm8RjYjlk
Disclaimer
The information and publications are not meant to be, and do not constitute, financial, investment, trading, or other types of advice or recommendations supplied or endorsed by TradingView. Read more in the Terms of Use.