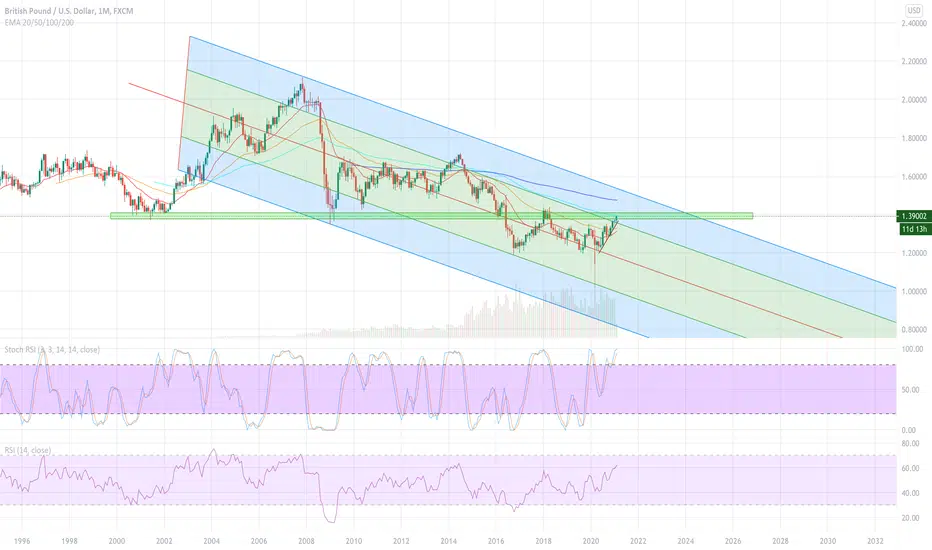
The monthly plug chart suggests that it's testing support (turned resistance) which dates back to the year 2001 - 21 years later it's knocking back on the support.
Plug looks severly overbought on all times frames, including the monthly.
Markets are due a correction very soon and the dollar rally against it's pairs could really bite into the plug.
Plug looks severly overbought on all times frames, including the monthly.
Markets are due a correction very soon and the dollar rally against it's pairs could really bite into the plug.
Related publications
Disclaimer
The information and publications are not meant to be, and do not constitute, financial, investment, trading, or other types of advice or recommendations supplied or endorsed by TradingView. Read more in the Terms of Use.
Related publications
Disclaimer
The information and publications are not meant to be, and do not constitute, financial, investment, trading, or other types of advice or recommendations supplied or endorsed by TradingView. Read more in the Terms of Use.