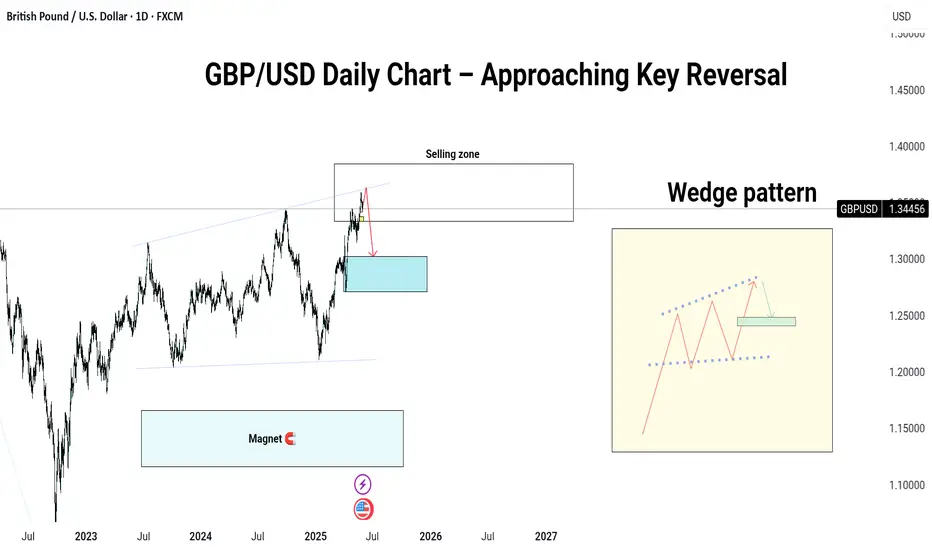
📉 GBP/USD Daily Chart – Approaching Key Reversal Zone
Price has tapped into the major selling zone (around 1.38000), aligned with long-term trendline resistance.
🔻 Bearish Outlook Active:
If this level holds, we may see a rejection and a drop toward the demand zone near 1.29000–1.30000.
⚠️ Short-term buyers beware — this could be the last push before reversal.
💡 Watch for confirmation candles or a break of the minor support (yellow zone) to validate the move.
🗣️ Do you see a sell setup here, or are bulls still in control? Drop your view below 👇
#GBPUSD #ForexAnalysis #GreenFireForex #TechnicalAnalysis #PriceAction #SupplyAndDemand #ForexTrading
---
Related publications
Disclaimer
The information and publications are not meant to be, and do not constitute, financial, investment, trading, or other types of advice or recommendations supplied or endorsed by TradingView. Read more in the Terms of Use.
Related publications
Disclaimer
The information and publications are not meant to be, and do not constitute, financial, investment, trading, or other types of advice or recommendations supplied or endorsed by TradingView. Read more in the Terms of Use.