May be market bearish in downfall.
📍Trade Setup:
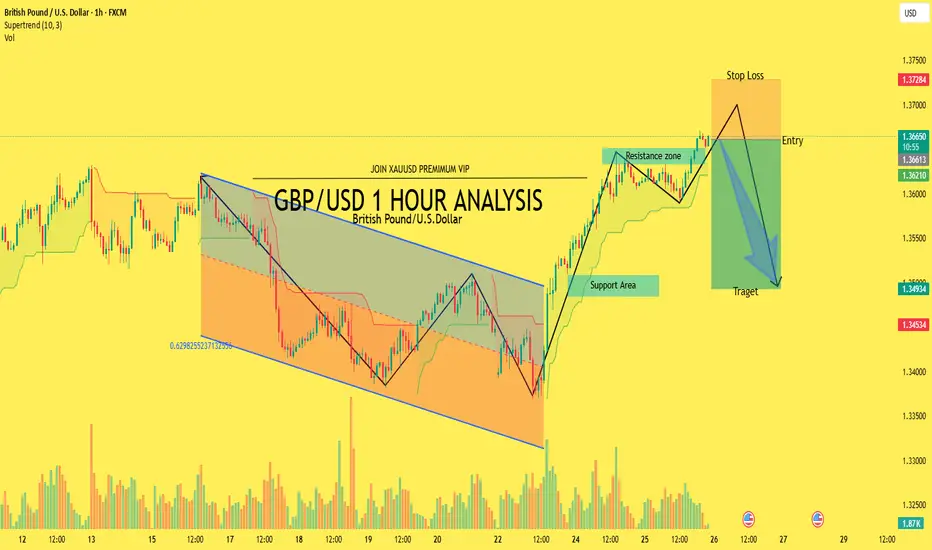
✅ Entry: Near the current price at around 1.3661, right at the resistance zone.
✅ Stop Loss: Above the resistance zone, around 1.3728, to protect against false breakouts.
✅ Target (Take Profit): Down towards 1.3494 or even 1.3453, which are marked as potential support areas.
🔍Technical Analysis Summary:
1. Previous Price Action:
Price was moving within a descending channel, indicating a downtrend. After reaching a support area near the lower boundary of the channel, price broke out to the upside.
2. Breakout:
A clear bullish breakout occurred from the descending channel, showing a shift from bearish to bullish sentiment. Price retested the support area, confirming the breakout.
3. Current Situation:
Price has reached a resistance zone, which previously acted as a supply area. The chart suggests a potential short setup from this resistance zone.
📊Additional Observations:
✔ There is a bearish confluence, with price testing resistance and a projected bearish arrow suggesting a potential reversal.
✔ The Supertrend indicator is still green, implying short-term bullishness — so caution is advised for aggressive shorts.
✔ Volume seems to have increased during the breakout, but no significant spikes are seen near resistance yet.
📍Trade Setup:
✅ Entry: Near the current price at around 1.3661, right at the resistance zone.
✅ Stop Loss: Above the resistance zone, around 1.3728, to protect against false breakouts.
✅ Target (Take Profit): Down towards 1.3494 or even 1.3453, which are marked as potential support areas.
🔍Technical Analysis Summary:
1. Previous Price Action:
Price was moving within a descending channel, indicating a downtrend. After reaching a support area near the lower boundary of the channel, price broke out to the upside.
2. Breakout:
A clear bullish breakout occurred from the descending channel, showing a shift from bearish to bullish sentiment. Price retested the support area, confirming the breakout.
3. Current Situation:
Price has reached a resistance zone, which previously acted as a supply area. The chart suggests a potential short setup from this resistance zone.
📊Additional Observations:
✔ There is a bearish confluence, with price testing resistance and a projected bearish arrow suggesting a potential reversal.
✔ The Supertrend indicator is still green, implying short-term bullishness — so caution is advised for aggressive shorts.
✔ Volume seems to have increased during the breakout, but no significant spikes are seen near resistance yet.
Trade closed: stop reached
Sorry guys sl hit Best Analysis xauuad single
t.me/+eZQd8QWqqvA5YzRk
VIP PREMIMUM ANALYSIS ROOM SIGNALS
t.me/+iLAu1r1c9PJiY2Nk
t.me/+eZQd8QWqqvA5YzRk
VIP PREMIMUM ANALYSIS ROOM SIGNALS
t.me/+iLAu1r1c9PJiY2Nk
Disclaimer
The information and publications are not meant to be, and do not constitute, financial, investment, trading, or other types of advice or recommendations supplied or endorsed by TradingView. Read more in the Terms of Use.
Best Analysis xauuad single
t.me/+eZQd8QWqqvA5YzRk
VIP PREMIMUM ANALYSIS ROOM SIGNALS
t.me/+iLAu1r1c9PJiY2Nk
t.me/+eZQd8QWqqvA5YzRk
VIP PREMIMUM ANALYSIS ROOM SIGNALS
t.me/+iLAu1r1c9PJiY2Nk
Disclaimer
The information and publications are not meant to be, and do not constitute, financial, investment, trading, or other types of advice or recommendations supplied or endorsed by TradingView. Read more in the Terms of Use.