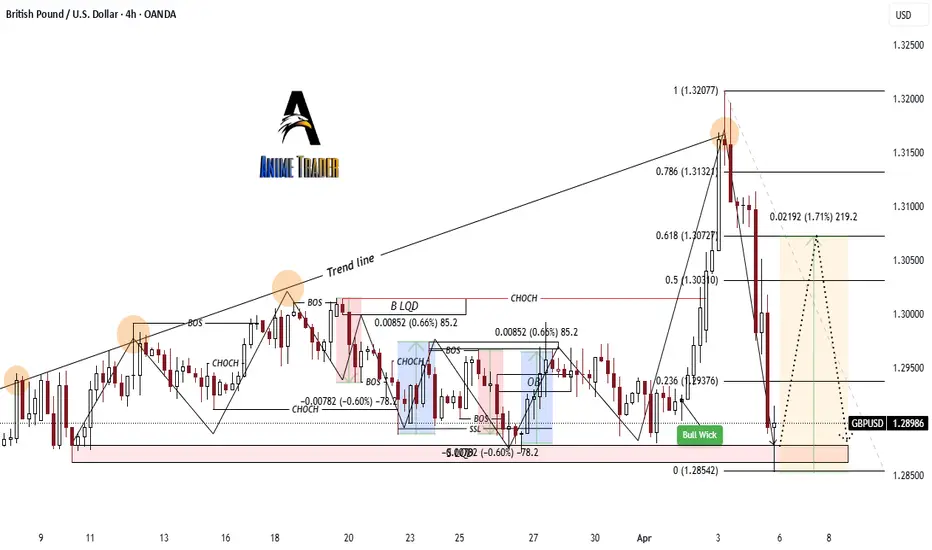
This *GBP/USD 4H chart* uses a mix of *Smart Money Concepts (SMC), **Fibonacci retracement, and traditional **market structure* analysis. Here's a breakdown of all the tools and patterns being applied:
---
### *1. Market Structure Tools*
- *BOS (Break of Structure)*
Indicates shifts in trend direction or confirmation of continuation.
- *CHoCH (Change of Character)*
Used to spot early trend reversals — typically the first sign of a shift in momentum.
---
### *2. Fibonacci Retracement*
- Drawn from swing low to swing high, showing standard levels:
*0.236, 0.382, 0.5, 0.618, 0.786, 1.0* — often used to identify potential retracement zones and entry points.
---
### *3. Order Block (OB)*
- Highlighted with a *blue rectangle*, showing a consolidation or base before a major move — often a point of interest for entries.
---
### *4. Liquidity Concepts*
- *Bull Wick* and *Stop Hunt Zones*
Represent manipulation zones or liquidity grabs where smart money triggers stop losses before reversing price.
---
### *5. Trendlines*
- *Upward-sloping Trend Line* connecting higher lows, suggesting an uptrend until structure was broken.
---
### *6. Range Bound Structure / Consolidation Box*
- Highlighted in rectangles where price moved sideways — often leads to breakout setups (used with CHoCH and BOS labels).
---
### *7. Price Projections*
- *Grey shaded zone* on the right with a measured retracement path — shows a possible bullish retracement after recent sell-off.
---
### *8. Candlestick/Price Action Tool*
- *Wicks and swing highs/lows* are analyzed to determine liquidity zones, fakeouts, and potential reversal points.
---
### *Pattern Observations*
- *Distribution Pattern* (top structure before the sell-off)
- *Range Accumulation* at the bottom (possibly forming a Wyckoff-style pattern for a bounce)
- Potential *Bearish Impulse followed by Bullish Retracement* setup
---
This chart reflects a sophisticated institutional-style analysis likely aiming for a short-term retracement before potential continuation, depending on how price reacts to key Fibonacci levels.
Would you like help planning a trade setup based on this chart?
---
### *1. Market Structure Tools*
- *BOS (Break of Structure)*
Indicates shifts in trend direction or confirmation of continuation.
- *CHoCH (Change of Character)*
Used to spot early trend reversals — typically the first sign of a shift in momentum.
---
### *2. Fibonacci Retracement*
- Drawn from swing low to swing high, showing standard levels:
*0.236, 0.382, 0.5, 0.618, 0.786, 1.0* — often used to identify potential retracement zones and entry points.
---
### *3. Order Block (OB)*
- Highlighted with a *blue rectangle*, showing a consolidation or base before a major move — often a point of interest for entries.
---
### *4. Liquidity Concepts*
- *Bull Wick* and *Stop Hunt Zones*
Represent manipulation zones or liquidity grabs where smart money triggers stop losses before reversing price.
---
### *5. Trendlines*
- *Upward-sloping Trend Line* connecting higher lows, suggesting an uptrend until structure was broken.
---
### *6. Range Bound Structure / Consolidation Box*
- Highlighted in rectangles where price moved sideways — often leads to breakout setups (used with CHoCH and BOS labels).
---
### *7. Price Projections*
- *Grey shaded zone* on the right with a measured retracement path — shows a possible bullish retracement after recent sell-off.
---
### *8. Candlestick/Price Action Tool*
- *Wicks and swing highs/lows* are analyzed to determine liquidity zones, fakeouts, and potential reversal points.
---
### *Pattern Observations*
- *Distribution Pattern* (top structure before the sell-off)
- *Range Accumulation* at the bottom (possibly forming a Wyckoff-style pattern for a bounce)
- Potential *Bearish Impulse followed by Bullish Retracement* setup
---
This chart reflects a sophisticated institutional-style analysis likely aiming for a short-term retracement before potential continuation, depending on how price reacts to key Fibonacci levels.
Would you like help planning a trade setup based on this chart?
Disclaimer
The information and publications are not meant to be, and do not constitute, financial, investment, trading, or other types of advice or recommendations supplied or endorsed by TradingView. Read more in the Terms of Use.
Disclaimer
The information and publications are not meant to be, and do not constitute, financial, investment, trading, or other types of advice or recommendations supplied or endorsed by TradingView. Read more in the Terms of Use.