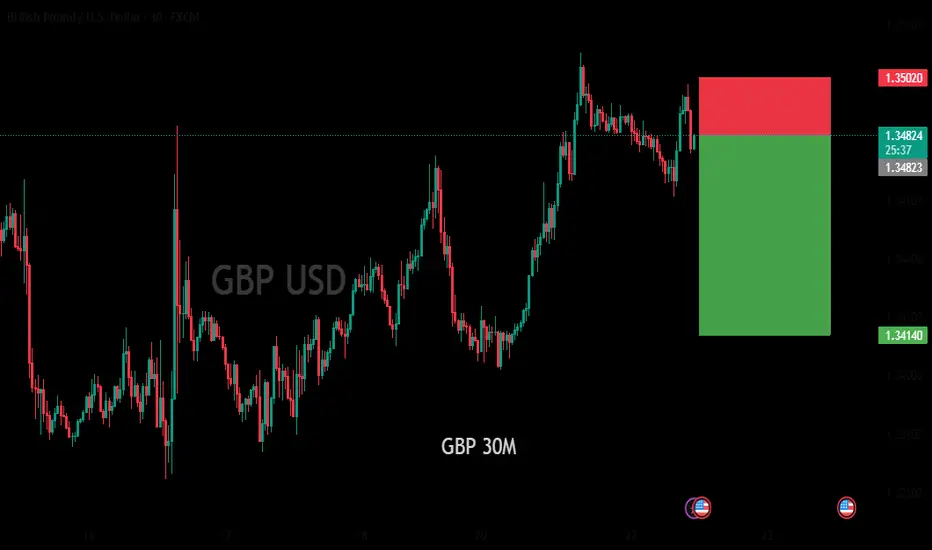
The chart displays the exchange rate of the British Pound (GBP) against the United States Dollar (USD) with a 30-minute time frame, as indicated by "30 - FXCM" at the top. The chart itself is a candlestick chart showing price movements over time, with pink and blue lines representing price fluctuations. A rectangle overlay on the chart is divided into two sections: a green lower part and a red upper part.
Trade active
keep hold Disclaimer
The information and publications are not meant to be, and do not constitute, financial, investment, trading, or other types of advice or recommendations supplied or endorsed by TradingView. Read more in the Terms of Use.
Disclaimer
The information and publications are not meant to be, and do not constitute, financial, investment, trading, or other types of advice or recommendations supplied or endorsed by TradingView. Read more in the Terms of Use.