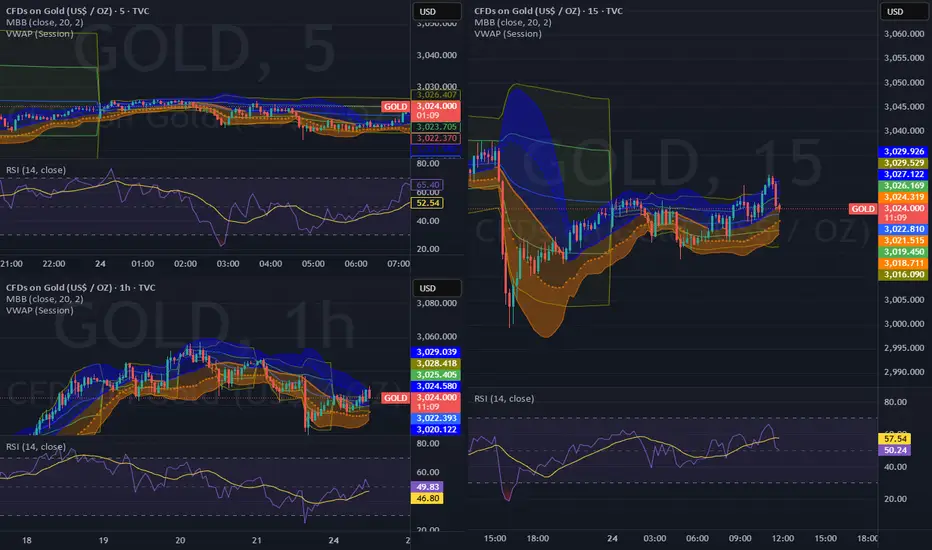
Based on the gold charts with the requested indicators (Bollinger Bands/MBB, VWAP with bands, and RSI 14), here's my analysis across the three timeframes:
Buy at 3,025
SL: 3,021.50
TP 1: 3,029.50
TP 2: 3,035.00
The VWAP session bands on all timeframes show price currently within the bands but starting to approach the upper band. The 1-hour chart shows resistance at around 3,028-3,029 (previous VWAP upper band area).
This setup takes advantage of the potential upward momentum indicated by the RSI readings across timeframes, with price finding support at the middle Bollinger Bands. The stop loss is placed below the recent support level and below the lower VWAP band on the 15-minute chart, while take profit targets aim for the upper Bollinger Band and recent resistance levels.
Buy at 3,025
SL: 3,021.50
TP 1: 3,029.50
TP 2: 3,035.00
- Current price: 3,024.10 with slight negative movement (-0.02%, -0.655)
- 5-minute chart: Price is trading between the MBB (3,024.78) and lower Bollinger Band, with RSI at 62.13 showing positive momentum but not overbought
- 15-minute chart: Price is near the MBB (3,021.52) with RSI at 57.55, indicating moderate bullish momentum
- 1-hour chart: Price is testing the MBB (3,015.66) as support, with RSI at 46.80 showing a potential shift from bearish to neutral/bullish momentum
The VWAP session bands on all timeframes show price currently within the bands but starting to approach the upper band. The 1-hour chart shows resistance at around 3,028-3,029 (previous VWAP upper band area).
This setup takes advantage of the potential upward momentum indicated by the RSI readings across timeframes, with price finding support at the middle Bollinger Bands. The stop loss is placed below the recent support level and below the lower VWAP band on the 15-minute chart, while take profit targets aim for the upper Bollinger Band and recent resistance levels.
Disclaimer
The information and publications are not meant to be, and do not constitute, financial, investment, trading, or other types of advice or recommendations supplied or endorsed by TradingView. Read more in the Terms of Use.
Disclaimer
The information and publications are not meant to be, and do not constitute, financial, investment, trading, or other types of advice or recommendations supplied or endorsed by TradingView. Read more in the Terms of Use.