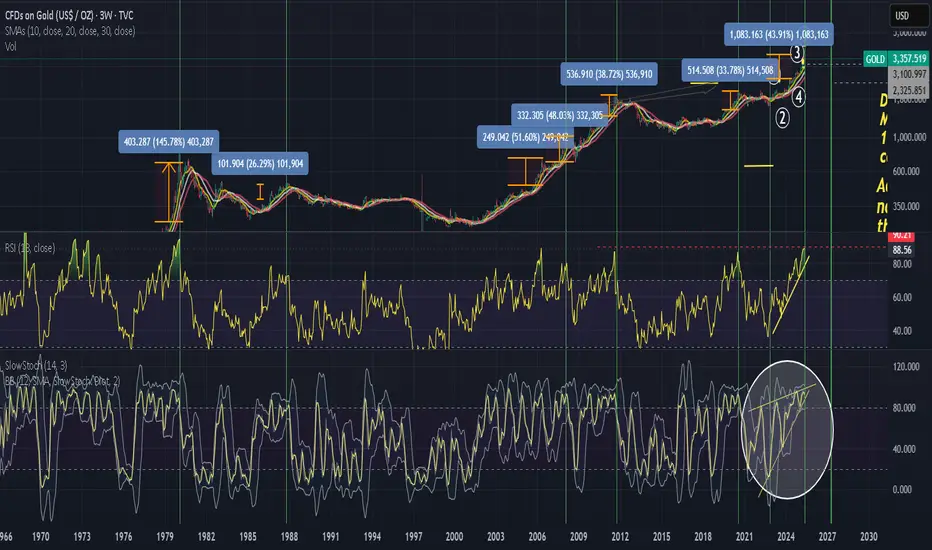
In this Chart you see:
- Price Chart of Gold in USA
- moving averages 10,20, 30 (MA10,20,30)
- extremal Deviation between MA30 and price at same time
Below of the price chart
- RSI
- Slow stochastic overlayed with Bollinger B.
The Slow stochastic shows, that a long term trend is in final area.
Comparing with correction in the past, now there are several conditions fillfulled for a massive correction, roundabout 20-30%
Disclaimer
The information and publications are not meant to be, and do not constitute, financial, investment, trading, or other types of advice or recommendations supplied or endorsed by TradingView. Read more in the Terms of Use.
Disclaimer
The information and publications are not meant to be, and do not constitute, financial, investment, trading, or other types of advice or recommendations supplied or endorsed by TradingView. Read more in the Terms of Use.