### 1. TRADE SIGNALS
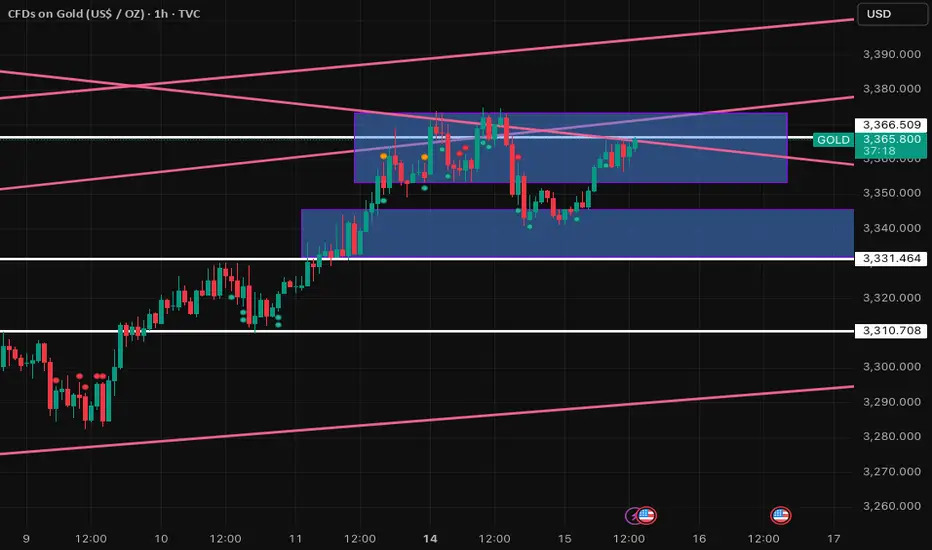
**Current Context:** XAUUSD is trading within a long-term ascending channel (4-hour, 1-hour charts) and is currently consolidating near the upper boundary of this channel and a significant multi-timeframe resistance zone around **3,366 - 3,375**. Lower timeframes (1-minute, 5-minute, 15-minute) show price testing a short-term descending trendline within this consolidation.
**Scenario A: Rejection from Multi-Timeframe Resistance (Short Bias)**
- **Reasoning:** Price is at a strong confluence of resistance: the upper boundary of the 4-hour ascending channel, a horizontal resistance zone (3,366 - 3,375), and a short-term descending trendline (1-minute, 5-minute). A confirmed bearish reversal pattern on lower timeframes (1-minute, 5-minute, 15-minute) or a strong bearish candle on higher timeframes (1-hour, 4-hour) from this zone would signal a sell opportunity.
- **SELL ENTRY:**
- **Clear Entry Price:** **3,360 - 3,365** (Enter on confirmation of bearish reversal, e.g., a strong bearish engulfing or pin bar closing below 3,365.509 on 1-minute/5-minute, or a clear rejection from the 1-hour/4-hour channel trendline).
- **BUY LIMIT / SELL LIMIT:** Consider a **SELL LIMIT** at **3,370 - 3,375** if price briefly spikes into the upper channel boundary/resistance and shows immediate rejection.
- **STOP LOSS AREA:**
- **Above 3,380** (Above the 3,366 - 3,375 resistance zone and the 4-hour channel's upper boundary, providing buffer for false breakouts).
- **TARGET AREAS:**
- **Target 1:** **3,340 - 3,345** (Immediate multi-timeframe support zone).
- **Target 2:** **3,331.464** (Key horizontal support).
- **Target 3:** **3,310.708** (Next major horizontal support).
- **Target 4:** Lower boundary of the 4-hour ascending channel (dynamic target).
**Scenario B: Breakout Above Multi-Timeframe Resistance (Long Bias)**
- **Reasoning:** If price decisively breaks and sustains above the **3,375** level and the upper boundary of the 4-hour ascending channel with strong bullish momentum and volume, especially on 1-hour or 4-hour charts. This would signal a significant bullish continuation.
- **BUY ENTRY:**
- **Clear Entry Price:** **3,376 - 3,380** (Enter after a confirmed breakout and a successful retest of 3,375 as new support, or a strong bullish continuation candle after the breakout).
- **STOP LOSS AREA:**
- **Below 3,360** (Below the newly broken resistance, now acting as support, and below the 4-hour channel's upper trendline).
- **TARGET AREAS:**
- **Target 1:** **3,400** (Psychological level, potential next resistance).
- **Target 2:** **3,449.078** (Major horizontal resistance, previous swing high).
### 2. CANDLESTICK PATTERNS
- **Consolidation/Indecision:** Across all timeframes (1-minute to 4-hour), price is forming small-bodied candles with wicks within the 3,350 - 3,375 range, indicating indecision and a tight battle between buyers and sellers at this resistance confluence.
- **Rejection Candles (1-minute, 5-minute):** The 1-minute and 5-minute charts show candles with upper wicks forming at the short-term descending trendline and the 3,365.509 horizontal resistance, suggesting rejection from these immediate levels.
- **Prior Bullish Momentum:** Leading into the current consolidation, there were periods of strong bullish candles, especially on the 1-hour chart, indicating the strength of the underlying uptrend within the channel.
### 3. MARKET STRUCTURE
- **Ascending Channel (4-hour, 1-hour):** XAUUSD is clearly trading within a well-defined ascending channel (pink trendlines) on the 4-hour and 1-hour charts, indicating a long-term bullish trend. Price is currently near the upper boundary.
- **Multi-Timeframe Resistance Zone:** The area around **3,366 - 3,375** is a significant resistance zone, acting as a ceiling for recent price action.
- **Immediate Support Zone:** On the 15-minute and 1-hour charts, a support zone is identified between **3,340 - 3,345**.
- **Key Horizontal Supports:**
- **3,331.464:** A strong horizontal support level.
- **3,310.708:** Another significant horizontal support.
- **Major Resistance:** **3,449.078** is a critical horizontal resistance, representing a prior major high.
- **Short-term Descending Trendline:** On the 1-minute and 5-minute charts, a short-term descending trendline (pink) is acting as immediate resistance within the current consolidation.
### 4. MULTI-TIMEFRAME CONFLUENCE
- **Strong Resistance Confluence:** The **3,366 - 3,375** horizontal resistance zone aligns with the upper boundary of the 4-hour ascending channel. This makes it a very strong multi-timeframe supply area. The 1-minute, 5-minute, 15-minute, and 1-hour charts all show price struggling at or below this area.
- **Aligned Support:** The **3,340 - 3,345** zone and the **3,331.464** level are consistently identified as support across multiple timeframes, reinforcing their importance.
- **Trend Consistency:** The underlying bullish trend (ascending channel) is evident on the 4-hour and 1-hour charts. The current consolidation on lower timeframes is occurring at a critical resistance point within this larger trend, indicating a potential reversal or a pause before a breakout.
### 5. PRICE ACTION & VOLUME
- **Momentum Slowdown:** The price action across all timeframes shows a clear slowdown in bullish momentum as price approaches the 3,366 - 3,375 resistance and the upper channel boundary.
- **Consolidation:** Price is in a tight consolidation range, indicating a balance between buyers and sellers. This often precedes a significant move.
- **Liquidity:** The repeated testing of the 3,366 - 3,375 zone suggests it's an area where significant sell orders might be present (order block), or where liquidity is being absorbed before a directional move.
### 6. KEY LEVELS TO WATCH
- **3,449.078:** Major horizontal resistance, previous swing high.
- **3,366.509 - 3,375:** Critical multi-timeframe resistance zone, upper channel boundary.
- **3,364.963:** Current price level, within the resistance zone.
- **3,340 - 3,345:** Immediate multi-timeframe support zone.
- **3,331.464:** Key horizontal support.
- **3,310.708:** Next major horizontal support.
- **Lower boundary of 4-hour ascending channel:** Dynamic support.
Trade closed: target reached
Taked profit Disclaimer
The information and publications are not meant to be, and do not constitute, financial, investment, trading, or other types of advice or recommendations supplied or endorsed by TradingView. Read more in the Terms of Use.
Disclaimer
The information and publications are not meant to be, and do not constitute, financial, investment, trading, or other types of advice or recommendations supplied or endorsed by TradingView. Read more in the Terms of Use.