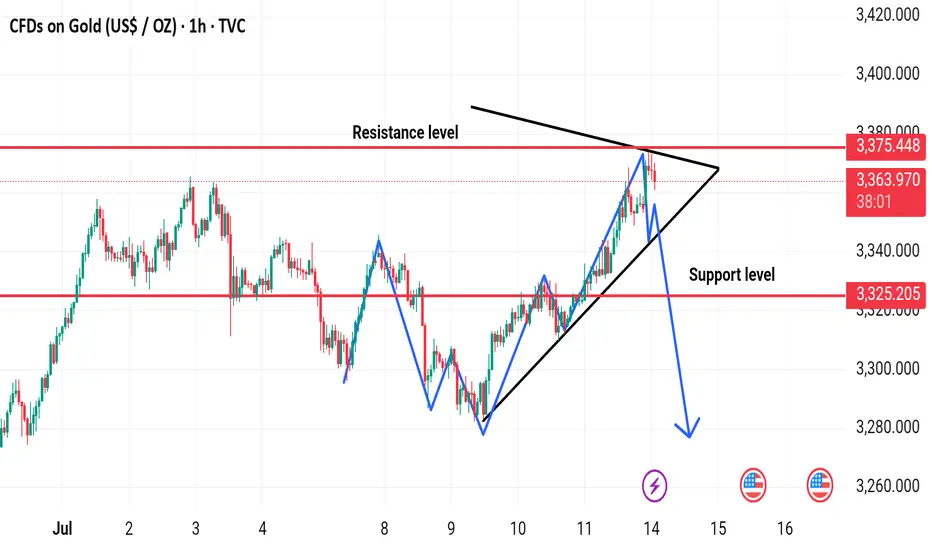
Recent patterns indicate a potential breakdown from an ascending triangle formation. With the price nearing the apex, a downward trend may be imminent if support levels are violated, suggesting caution for bullish positions.
Detailed analysis
Tendency and Graphic Structure
The chart showcases an ascending triangle, indicating potential upward price pressure. However, recent price movements suggest a potential breakdown through the triangle's support line, signaling bearish implications.
Volume and Volatilitv
The price action reflects medium volatility with consistent buying and selling volumes. A notable increase in selling pressure would confirm the bearish trend and possibly lead to further declines.
RSI and Market Sentiment
Indicators like RSI or MACD indicate a neutral sentiment, suggesting insufficient momentum to sustain a breakout. Any divergence would require further monitoring for impending price actions.
Current support is around 3,325, with resistance near 3,375. A breach below support could trigger a significant move downwards.
Consolidation and Reversal Points
Consolidation is evident near the triangle's apex, but recent price action shows signs of slowing momentum, indicating possible reversal points. Watch for a decisive break below support for confirmation.
🔵 Free Telegram
t.me/FarazxauusdGoldT
⭕️ Disclaimer: Not Financial advice.
For Education Purposes only
t.me/FarazxauusdGoldT
⭕️ Disclaimer: Not Financial advice.
For Education Purposes only
Disclaimer
The information and publications are not meant to be, and do not constitute, financial, investment, trading, or other types of advice or recommendations supplied or endorsed by TradingView. Read more in the Terms of Use.